1. Executive Summary and Action Signal
1.1. Immediate Market Context
The Gold Spot/US Dollar (XAU/USD) is currently exhibiting high volatility around the critical $4,000 psychological level. The market remains underpinned by powerful long-term bullish structural factors, primarily continuous central bank gold purchases 1 and anticipation of potential interest rate cuts by the U.S. Federal Reserve (Fed).3 However, recent price action analysis suggests that the market is technically overextended and is highly susceptible to a short-term mean reversion pullback.5
Following a rally to a recent peak near $4,060, the price experienced a sharp and intense reversal. This decline occurred on high volume, indicating not just profit-taking but potentially the initiation of active institutional distribution or hedging activity.6 This selling pressure presents a significant short-term risk to existing bullish positions. If the price confirms stability below the key $4,012 level, the likelihood of a corrective decline increases substantially, creating a strategic short-term SELL opportunity.
1.2. Trading Signal Summary
Considering all analyses, a SELL signal is proposed to capitalize on the anticipated short-term technical correction. This strategy does not challenge the strong long-term bullish trend but is designed to profit from the necessary correctional phase expected to return the market to its short-term mean.
| Trade Parameters | Level |
| Proposed Signal | SELL (Short-Term Correction Trade) |
| Timeframe | Intraday to 1-3 Days |
| Entry Trigger | Confirmed 1-hour candle close below $4,012.00. |
| Stop Loss | $4,045.00 |
| Target 1 (T1) | $3,970.00 |
| Target 2 (T2) | $3,920.00 |
| Risk/Reward Ratio | Greater than 1:2.3 for T2. |
2. Technical Analysis (TA): Chart Breakdown
2.1. OANDA H1 Chart Review (Price Action and Momentum)
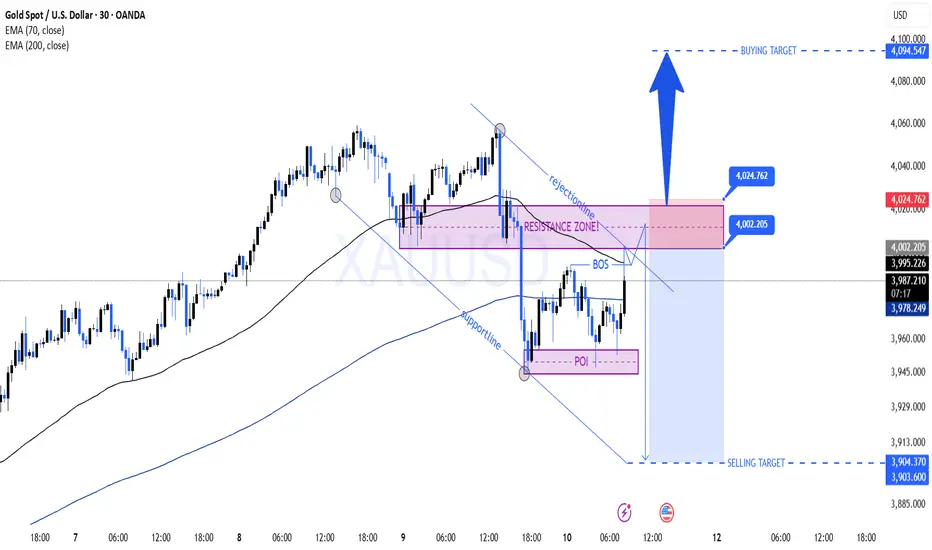
Reviewing the attached OANDA 1-hour chart, XAU/USD completed a strong bullish rally from the $3,900 zone toward $4,060, reflecting the prevailing uptrend. However, upon reaching the peak near $4,060, the price swiftly retreated. This rapid decline was accompanied by high volatility, marking it as the most volatile day in the last five months and the highest volume day in six months.6 The high-volume sell-off suggests this was not merely weak long liquidation but rather initiative selling by active institutional players.
The Momentum Indicator, MACD, supports this analysis. Although MACD is attempting to recover into the bullish region following a recent bearish crossover, supporting the short-term rebound from $3,950, its scale remains below the recent bullish peaks. This lack of robust momentum suggests that the upward impulse required to sustain prices above $4,000 is weakening.
Crucially, Gold has failed to sustain a firm close within its upper Keltner band for the past month.6 This is a key technical signal. When an asset in a strong trend fails to maintain momentum outside its dynamic channel or indicator, especially on high volume, it typically indicates a failed breakout and the necessity for a mean reversion move. This prepares the market for a “healthy correction.”
2.2. Key Support and Resistance Levels
The current daily Pivot Point analysis is highly relevant, given the price is trading near the $4,000 psychological level. The daily Pivot Point (P) is situated at $3995.91.7 Trading above this level is traditionally considered a bullish signal.
However, a clear bearish bias is established if the price firmly positions itself below the $4,012.00 level. A confirmed stance below this trigger level could unlock a cascading decline, potentially targeting lower support areas such as $3,892.00.5
To the upside, the nearest resistance is R1 at $4044.79. Above that, R2 is located at $4071.68, which is near the recent record high in December futures ($4,072.40).7 These higher levels are likely to serve as major liquidation and selling zones for institutional traders.
On the downside, immediate support S1 is at $3969.02, and the next critical support S2 is at $3920.14.7 The $3,920 zone serves as the primary crucial target for this anticipated short-term correction.
XAU/USD Daily Technical Levels (OANDA/FOREX.com Reference)
| Level | Price Zone | Significance | Source |
| R2 (Strong Resistance) | $4071.68 | Major Resistance / High Liquidation Zone | 7 |
| R1 (Immediate Resistance) | $4044.79 | Short-term Ceiling (Near recent chart high) | 7 |
| Bearish Confirmation | $4012.00 | Bearish Bias Trigger for Mean Reversion | 5 |
| Pivot Point (P) | $3995.91 | Trend Deciding Level (Psychological relevance) | 7 |
| S1 (Immediate Support) | $3969.02 | Immediate Dip Buyer Area | 7 |
| S2 (Intermediate Support) | $3920.14 | Strong Support / Initial Mean Reversion Target | 5 |
| S3 (Major Support) | $3893.25 | Medium-Term Bullish Floor (Near 20-day MA) | 5 |
3. Fundamental and Macro-Economic Factors
3.1. Gold’s Safe-Haven Status and Geopolitical Risks
Gold’s current elevated price is largely driven by its safe-haven status and a premium generated by ongoing geopolitical instability.2 The persistent conflicts in Gaza and Ukraine continue to offer unwavering support to the metal.4 However, any hints of progress toward a potential deal between Israel and Hamas, involving hostage releases and troop withdrawals, could lead to a minor reduction in safe-haven demand.9 Such a scenario would cap Gold’s upward momentum in the short term.
The long-term bullish structural drivers include the unprecedented pace of central bank buying. Global central banks have purchased more gold in the last four years than in the previous 21 years combined.1 This not only bolsters supply-demand dynamics but also positions Gold as one of the most optimal hedges against currency debasement, recession, and U.S. policy risks.2 Furthermore, the protracted risk of a U.S. government shutdown continues to heighten market uncertainty, which historically provides a positive lift to Gold as a safe-haven asset.4
3.2. USD Dynamics and Fed Policy Expectations
The dynamics of the U.S. Dollar (USD) remain a primary counter-driver for Gold prices. Typically, a weaker USD increases Gold’s appeal as it reduces the opportunity cost of holding the non-yielding asset.1 Expectations for future interest rate cuts have created a favorable environment for Gold.4
However, the USD is currently maintaining a relatively strong position, trading near a nine-week high, with the 10-year Treasury note yield standing at 4.133%.9 This USD resilience suggests that the Gold market is entering a consolidation or correction phase, where swift upward moves will be limited. The fact that Gold is holding near $4,000 despite a stronger dollar and stable yields underscores its powerful underlying demand.
3.3. Upcoming High-Impact Events (October 13-17, 2025)
The coming week (October 13-17) is scheduled for the release of crucial U.S. economic data, which could introduce extreme volatility for the USD and Gold.10 This data is paramount for determining the Fed’s future policy path.
The key high-impact events are:
- Wednesday, October 15: Consumer Price Index (CPI) and Real Earnings.10
- Thursday, October 16: Producer Price Index (PPI).10
These inflation readings pose a significant two-sided risk to Gold. If CPI or PPI data comes in hotter than expected, it could force the Fed to temper rate cut plans, leading to a stronger USD and intense negative pressure on Gold, exacerbating any technical breakdown. Conversely, if the government shutdown is prolonged, the release of this critical data could be delayed.11 Uncertainty caused by a lack of data or delays tends to increase the instability premium in the market, temporarily supporting Gold as a safe haven. It is essential to structure trading strategy with these asymmetric risks in mind.
Upcoming US Economic Event Calendar (October 13-17, 2025)
| Date | Time (EST) | Event | Market Impact | Source |
| Wednesday, Oct 15 | 08:30 AM | Consumer Price Index (CPI) for September | Core Inflation Data (High-impact USD/Gold Volatility) | 10 |
| Wednesday, Oct 15 | 08:30 AM | Real Earnings for September 2025 | Wage Growth/Inflationary Pressure Indicator | 10 |
| Thursday, Oct 16 | 08:30 AM | Producer Price Index (PPI) for September | Factory Gate Inflation (Early sign of price pressure) | 10 |
| Friday, Oct 17 | 08:30 AM | U.S. Import and Export Price Indexes for September | Trade/Inflation Pressure Indicator | 10 |
4. Market Sentiment and Positioning
4.1. COT Analysis: Institutional Flow in the Futures Market
The Commitment of Traders (COT) report is vital for gauging institutional positioning in the futures market.12 Based on the latest available data (As of W39, 2025), Managed Money (considered Large Speculators) holds a substantial Net Long Position of 158,616.00 contracts in Gold Futures.13 Although this figure has slightly decreased from the previous week (160,483.00), this positioning is still near historically high levels.
Large Speculators in the futures market typically move inversely to Commercial Traders (Hedgers).14 The massive net long position held by speculators strongly implies that Commercials are likely net short, demonstrating heavy hedging activity at these elevated price levels. Such a situation creates market fragility, as Large Speculators are often overextended near market peaks.14
This high concentration of long positions creates a “Crowded Trade” risk, meaning the market is extremely sensitive to any negative trigger. Should a bearish trigger occur (like a technical breakdown below $4,012 or unexpectedly strong USD data), the rapid, compulsory liquidation (sell-off) of these numerous long positions could trigger a chain reaction. This has the power to turn the expected correction into a severe decline. This liquidation risk is highest when the critical support zone of $4,012 is breached.
Gold Futures COT Report: Managed Money Net Position (W39, 2025)
| Reporting Category | Date (Data As Of) | Net Position (Contracts) | Trend Interpretation | Source |
| Managed Money (Speculators) | 2025 W39 | 158,616.00 | Bullish Positioning, but near high level historical resistance. | 13 |
| Managed Money (Previous) | 2025 W38 | 160,483.00 | Minor reduction in net long positioning, suggesting initial caution. | 13 |
| Commercials (Hedgers) | (Inferred Data) | (Implied High Net Short) | Acting as counter-trend hedgers, selling into strength. | 14 |
4.2. Retail Sentiment and Volatility
Sentiment among retail traders is currently polarized. Some traders anticipate extremely high bullish targets like $5,000 or even $6,000, illustrating the level of market excitement. Conversely, others are predicting a major crash towards $3,700.16 This extreme divergence is often observed near market tops and is a classic signal of rising instability.
Analysis suggests that smart money frequently builds positions during “chop and liquidity traps” between $3970–$4030.16 These volatility traps are designed to liquidate weak long positions. If traders anticipate this narrow range, any break outside of it (especially below $3970) could trigger stop losses and gain rapid momentum. OANDA’s News Sentiment data shows that both market interest and sentiment regarding Gold are cooling after the rapid rally 17, indicating caution ahead of a potential pullback.
5. Synthesis, Risk Assessment, and Potential Price Scenarios
5.1. Synthesis of Bullish and Bearish Arguments
The long-term outlook for Gold is fundamentally bullish. Strong central bank demand and persistent geopolitical risks provide a solid foundation. However, the short-term strategic vulnerabilities are evident. The market is overstretched, technically displays a strong bearish bias below $4,012, and the excessive long positioning by speculators creates a high risk of a large liquidation cascade. The short-term correction is the most probable path due to these accumulated risks.
5.2. Key Risks and Trigger Points
The primary risk stems from the upcoming U.S. inflation data. If Wednesday’s CPI data is stronger than expected, Fed rate cut expectations will diminish, and the USD will strengthen sharply. This event, combined with technical weakness and overcrowded COT positioning, would serve as a severe trigger for a sharp decline.
- Bearish Trigger: A confirmed 1-hour candle close below $4,012.
- Bullish Trigger: If bulls successfully defend the $3995.91 (Pivot Point) and $3969.02 (S1) support levels and confirm stability above $4,045 (R1).
5.3. Upper/Lower Target Zone Projection
1. Bearish Scenario (Short-Term Expectation):
If a confirmed breakdown below $4,012 occurs, the liquidation of speculator longs could quickly accelerate. The price could first fall towards $3,970 (S1) and then target $3,920 (S2).5 The $3,920 zone would signify a healthy corrective phase, potentially attracting strong dip-buying interest from long-term bulls.
2. Bullish Scenario (Alternative):
If the $4,012 level holds and bulls successfully defend $3,995 (Pivot Point), they may attempt to retest $4,045 (R1), with the next objective being $4,071 (R2). However, the COT positioning and high-volume selling pressure present strong headwinds on this path.
6. Final Trading Signal and Execution Plan
6.1. Trading Signal: SELL (Short-Term)
From a short-term perspective, a corrective SELL position on XAU/USD is proposed. The market is technically ripe for a pullback due to high-volume selling and MACD weakness. This situation is amplified by the liquidation risk associated with the overextended long positions held by large speculators. Confirmation below $4,012 activates this risk, opening the path for a decline toward $3,920.
6.2. Entry, Stop Loss, and Target Levels
| Parameter | Price Level | Rationale |
| Signal | SELL | Short-Term Correction/Mean Reversion Trade. |
| Entry | $4,012.00 (Confirmation required) | Bearish bias confirmed below this level.5 |
| Stop Loss | $4,045.00 | Set above R1 ($4,044.79) to maintain a safe distance.7 |
| Target 1 (T1) | $3,970.00 | S1 ($3,969.02) daily support zone and initial profit-taking target.7 |
| Target 2 (T2) | $3,920.00 | S2 ($3,920.14) strong intra-day support and key bearish objective.5 |
6.3. Risk Management Strategy
As the proposed trade is a counter-trend strategy, strict risk management is mandatory. Entry should be confirmed by waiting for a 1-hour candle close below the $4,012.00 level to reduce the risk of a “fake-out.”
Furthermore, caution is required ahead of Wednesday’s high-risk CPI data release. Partial profit must be taken at T1 ($3,970), and the stop loss should be moved to the entry point (breakeven) to protect capital if the market reverses sharply due to unexpected inflation data.10
Works cited
- Gold prices witness historic rally, breach $4,000 mark for the first time. What’s driving the surge?, accessed on October 12, 2025, https://m.economictimes.com/markets/commodities/news/gold-prices-hit-record-high-nears-4000/oz-mark-on-safe-haven-demand/articleshow/124374669.cms
- A new high? | Gold price predictions from J.P. Morgan Research, accessed on October 12, 2025, https://www.jpmorgan.com/insights/global-research/commodities/gold-prices
- Will gold, silver prices continue rising? Here’s how to invest wisely, accessed on October 12, 2025, https://m.economictimes.com/wealth/invest/will-gold-silver-prices-continue-rising-heres-how-to-invest-wisely/articleshow/124302512.cms
- Safe-haven demand rises amid US government shutdown; silver also hits 60% gain – The Times of India, accessed on October 12, 2025, https://timesofindia.indiatimes.com/business/india-business/gold-prices-hit-record-4000-in-ny-safe-haven-demand-rises-amid-us-government-shutdown-silver-also-hits-60-gain/articleshow/124368387.cms
- Gold (XAU/USD): Overstretched uptrend, risk of minor pull-back …, accessed on October 12, 2025, https://www.marketpulse.com/markets/gold-xauusd-overstretched-uptrend-risk-of-minor-pull-back-below-4012/
- Gold Volatility Perks Up At $4k, Though Pullbacks Could Be Limited – FOREX.com, accessed on October 12, 2025, https://www.forex.com/en-uk/news-and-analysis/gold-volatility-perks-up-at-4k-though-pullbacks-could-be-limited/
- XAU USD Chart & Rate – FOREX.com, accessed on October 12, 2025, https://www.forex.com/en/gold-silver-trading/xau-usd/
- Safe-haven demand continues in powerful bull runs in gold, silver | Kitco News, accessed on October 12, 2025, https://www.kitco.com/news/article/2025-10-08/safe-haven-demand-continues-powerful-bull-runs-gold-silver
- Gold and Silver Price Forecast: Gold toward $4100 and silver above $50? Here’s impact of fed policy, industrial demand, market reaction, geopolitical influence, technical analysis – The Economic Times, accessed on October 12, 2025, https://m.economictimes.com/news/international/us/gold-and-silver-price-forecast-gold-toward-4100-and-silver-above-50-impact-of-fed-policy-industrial-demand-market-reaction-geopolitical-influence-technical-analysis-fed-rate-cuts-dollar-index-market-outlook-silver-institute-demand-us-economy-geopolitical-tensions-crude-oil-prices-xag-usd-short-term-price-outlook/articleshow/124428684.cms
- Schedule of Selected Releases for October 2025 – Bureau of Labor Statistics, accessed on October 12, 2025, https://www.bls.gov/schedule/2025/10_sched_list.htm
- Week Ahead Economic Preview: Week of 13 October 2025 | S&P Global, accessed on October 12, 2025, https://www.spglobal.com/marketintelligence/en/mi/research-analysis/week-ahead-economic-preview-week-of-13-october-2025.html
- Understanding the COT Report: Features, Types, and Usage Explained – Investopedia, accessed on October 12, 2025, https://www.investopedia.com/terms/c/cot.asp
- CFTC – Gold Futures & Options – Managed Money Net Position | Series – MacroMicro, accessed on October 12, 2025, https://en.macromicro.me/series/8308/gold-futures-and-options-manage-money-net-position
- Commitments of Traders Charts and Analysis – COTBase.com, accessed on October 12, 2025, https://cotbase.com/on-cot/typical_setups/
- Inside the Oil Market: The Relationship Between Commercial Trading Activity and Subsequent Price Movements by – NYU Stern, accessed on October 12, 2025, https://www.stern.nyu.edu/sites/default/files/assets/documents/con_042989.pdf
- Gold Spot US Dollar (XAU USD) Scoreboard – Investing.com, accessed on October 12, 2025, https://www.investing.com/currencies/xau-usd-scoreboard
- Trade Gold | OANDA Global Markets, accessed on October 12, 2025, https://www.oanda.com/bvi-en/cfds/instruments/xau-usd/
Leave a Reply