I. Executive Summary: 10 October 2025 XAU/USD Signal Overview
The analysis of Gold (XAU/USD) for October 10, 2025, reveals a critical juncture where short-term technical exhaustion meets powerful long-term fundamental support. Following a rapid ascent to historical highs near $4,042/oz and the subsequent sharp technical correction, the market is positioned for a high-probability tactical long trade. This correction, visible on the 1-hour chart, is interpreted not as a structural reversal but as a necessary cleansing of leveraged speculative positions (profit-taking), aligning with the sustained bullish thesis driven by dovish Federal Reserve (Fed) policy and persistent geopolitical hedging demand.1
The structural tailwinds remain strongly positive, anticipating further gains toward the next major resistance cluster. The strategy centers on initiating a tactical long position by setting a limit order at a conservative entry point, confirming the successful defense of a key psychological and technical pivot near $3,970/oz.3
Optimal Trading Session
The volatility profile and liquidity requirements for this tactical trade necessitate execution during the New York trading session, specifically during the high-liquidity overlap with the London session (13:00 – 17:00 GMT).4 This timing ensures that the trade is confirmed by major US institutional flows reacting to the previous days’ Fed commentary, maximizing the probability of a sharp rebound from the support level.
Tactical Parameters at a Glance
The following table details the recommended high-conviction tactical long setup for XAU/USD on October 10, 2025:
XAU/USD Long Signal (Buy Limit) – 10 October 2025
| Parameter (প্যারামিটার) | Value ($/oz) | Rationale Highlight |
| Optimal Session (সেরা সেশন) | New York (13:00 – 21:00 GMT) | Peak US-centric liquidity and volatility.4 |
| Entry Price (প্রবেশ মূল্য) | $3,968.00 | Conservative entry confirming defense of the $3,970 psychological/technical pivot.3 |
| Stop Loss (SL) | $3,938.00 | Placed below the major $3,920 support cluster, maintaining a buffer against volatility spikes. |
| Take Profit 1 (TP1) | $4,028.00 | Targeting immediate resistance (50% retracement of the recent drop from $4,042). |
| Take Profit 2 (TP2) | $4,078.00 | Targeting initial Weekly resistance/extension zone $4,084–$4,113.5 |
| Risk/Reward Ratio (TP2) | 3.66:1 | High-probability, asymmetric risk profile based on a $30 risk. |
II. Macro and Fundamental Architecture (Q4 2025 Context)
The trajectory of XAU/USD is overwhelmingly bullish as the market enters the final quarter of 2025. This structural strength is not based merely on speculation but is driven by several resilient macroeconomic factors that reinforce gold’s role as a strategic asset.
The Sustained Structural Bullish Thesis
Gold’s significant rally throughout 2025, which saw prices exceed $4,000/oz in early October 6, is fundamentally sound. The primary drivers are persistent geopolitical uncertainty, heightened trade uncertainty, and tariff risks.2 These factors combine to sustain robust safe-haven demand from both central banks and institutional investors seeking a hedge against systemic risk.
A major tailwind for gold is the shifting monetary policy stance of the Federal Reserve. After a lengthy pause, the Fed resumed trimming interest rates in September 2025, prioritizing labor market weakness over persistent inflation concerns.1 Market expectations suggest there may be “two more cuts to come in Q4”.1 The implication of lower interest rates is twofold: it reduces bond yields, making non-interest-bearing assets like gold relatively more appealing, and it exerts downward pressure on the US Dollar (USD).1
The slide in the US Dollar (USD) acts as an undeniable benefit for XAU/USD, as it makes the dollar-denominated commodity cheaper and more attractive for buyers utilizing other currencies.1 Continued dovish rhetoric, such as the comments from NY Fed President John Williams regarding a slowdown in hiring and support for “lower rates later this year” 7, solidifies expectations for a structurally weaker USD environment, providing continued support for bullion.
Price Overheating and Necessary Correction
The market’s aggressive move, front-running policy shifts, led to prices touching $4,042/oz in October, significantly surpassing early 2025 institutional forecasts.6 This aggressive pricing introduced the risk of market overheating.1 The sharp correction witnessed on the 10th of October, dropping the price below $3,980, is fundamentally beneficial. It represents essential de-risking and profit-taking by leveraged funds that had accumulated gains on the rally to $4,042. This process clears the market of weak long positions, thereby strengthening the foundation for the next sustained leg of the advance towards the $4,100+ region. The fundamental thesis strongly supports the approach of buying this current dip, as the correction improves the quality of the subsequent entry point by reducing immediate volatility risk.
J.P. Morgan Research encapsulates this structural view, deeply convinced of a continued bull case for gold. The institution emphasizes gold’s role as the most optimal hedge against the unique combination of stagflation, recession probabilities, currency debasement, and U.S. policy risks anticipated in 2025 and 2026.2 This long-term institutional perspective confirms that tactical volatility is an accumulation opportunity for strategic investors.
Analyst Consensus and Institutional Targets
While the immediate price action reflects short-term profit-taking, institutional analysts maintain a dominant bullish outlook for Q4 2025.
Institutional Gold Price Forecasts (Q4 2025)
| Institution | Q4 2025 Average Target ($/oz) | Near-Term Catalyst |
| JPMorgan Chase & Co. | $3,675 (Average) | Recession/Stagflation Hedge 2 |
| TD Securities | ~$4,000 | Looser Monetary Policy Expectations 8 |
| Citigroup/UBS | $3,800 | Sustained Central Bank and Investor Demand 8 |
| Current Price Context | ~$3,974.21 | Already exceeded many targets, indicating potential overheating risk 6 |
III. Commitments of Traders (COT) and Sentiment Dynamics
Analysis of the institutional positioning via the Commitments of Traders (COT) Report provides crucial context regarding market saturation and reversal risk.
Institutional Positioning Review
The latest available COT Report for Gold indicates substantial activity among large institutional players.9 Commercials (producers and hedgers) hold a significant net short position of contracts, which is a typical hedging behavior.9 Conversely, Leveraged Funds, classified as Non-Commercials or Large Speculators, maintain high conviction with net long positions totaling contracts.9
This high net long position among speculators confirms that they drove the recent run-up to $4,042/oz. However, this positioning inherently exposes them to significant volatility and rapid liquidation risks, a factor contributing to the sharp drop observed on the 10th of October.
The COT Index Discrepancy
A particularly nuanced observation arises from the 6-month COT Index, which is reported at an unusually low 4.0%.9 The COT Index measures the current net position relative to the highest and lowest net positions recorded over the past six months (0% being the lowest net long/highest net short, 100% being the opposite extreme).
Typically, a price at historic highs with substantial net long speculative positions would register an index value significantly higher (e.g., above 70%), signaling a highly saturated market top. The finding of 4.0% suggests that while the absolute volume of speculative longs is high, it is near the lower end of the historical range of positioning observed over the preceding half-year. This unusual data implies that the gold market has either experienced a massive, rapid flush-out of marginal long positions leading up to or immediately following the $4,042 peak, or that the rally has been underpinned more heavily by sustained institutional strategic accumulation (which sometimes doesn’t perfectly align with the typical futures reporting structure) rather than transient speculative fervor.
This low index provides a crucial technical endorsement of the structural continuation thesis. It indicates that the current speculative positioning, relative to its recent extremes, is not currently overstretched. This data supports the view that the correction witnessed on the H1 chart was sufficient to cleanse the market, validating the tactical approach of buying the dip with tightly managed risk.
IV. News Event Impact Analysis: October 9–10, 2025
The price action observed on October 10 is largely a reaction and digestion phase following two highly influential events regarding US monetary policy that occurred earlier in the week.
Immediate Market Drivers (Oct 8-9)
The market entered October 10 after processing the implications of the FOMC Meeting Minutes (Oct 8) and Fed Chair Jerome Powell’s speech (Oct 9).10 Gold traditionally benefits significantly from a dovish Fed outlook and rate cut expectations.10 The preceding dovish commentary from influential Fed officials, focusing on labor market weakness and anticipating lower rates 7, had successfully fueled the structural rally towards $4,042/oz.
The sharp decline observed after the peak suggests that the news provided the necessary liquidity for major funds to execute profit-taking orders near the significant resistance barrier of $4,040. This is a common “sell the news” dynamic, where the price peak coincides with the release of the anticipated supportive news, allowing for profitable liquidation. The resulting high volatility (as noted for the Powell speech 10) allowed for a rapid correction.
Focus on October 10 Economic Calendar
For the day of October 10, the US economic calendar lacks any major, direct high-impact releases such as Non-Farm Payrolls (NFP) or Consumer Price Index (CPI) data. The primary scheduled event is the UK Jobs Report.10
While the UK data will drive volatility in GBP-related pairs, its impact on XAU/USD is indirect. If the UK employment data is strong, it may temporarily boost global risk appetite during the London session, potentially slightly curtailing safe-haven demand for gold. However, the dominant influence on Gold remains the US Dollar, US interest rates, and institutional flows reacting to the previous day’s Fed input.
Volatility Management Strategy
Since the primary US catalysts have already occurred, the market on October 10 is expected to transition from chaotic price discovery to a structured digestion phase. In the absence of fresh economic shock data, market movement will be heavily reliant on technical defense of key levels and existing sentiment.3 The strategy requires delaying trade execution until the start of the New York session. This delay is essential to observe how US participants process the long-term implications of the dovish Fed commentary and whether they are prepared to accumulate at the newly discounted price, thereby validating the defense of the $3,970 pivot point.
Furthermore, monitoring US Treasury bond yields is critical. Long-end Treasuries, particularly the 30-year bond sale scheduled for the previous day, have been struggling, spurring the recent rally in gold as a safe haven.7 Any sudden reversal in yields (a spike) would indicate renewed risk appetite or a sharp rise in inflation expectations, immediately threatening the tactical long setup.
V. Technical Due Diligence (Multi-Timeframe Analysis)
Technical analysis across multiple timeframes provides essential validation for the entry, stop-loss, and target selection, confirming that the short-term tactical dip is situated within a dominant long-term uptrend.
Structural Trend Assessment (Weekly/Daily)
The prevailing structural trend for XAU/USD remains strongly bullish. Technical summaries across daily, weekly, and monthly timeframes overwhelmingly reflect a “Strong Buy” recommendation.12 XAU/USD was poised to mark its eighth-consecutive weekly advance 5, underscoring the dominance of the bullish momentum.
Key structural support levels define the validity of the long-term trend. The prior monthly open support rests near $3,859.00 5, while the strong psychological and structural support cluster is located around $3,920.00.3
The primary bullish objective, or major resistance zone, is clearly identified by technical confluence between $4,084 and $4,113. This region is defined by the 100% extension of the November rally and the extension of the April decline.5 A confirmed weekly close above this zone would fuel the next significant leg of the multi-year advance.
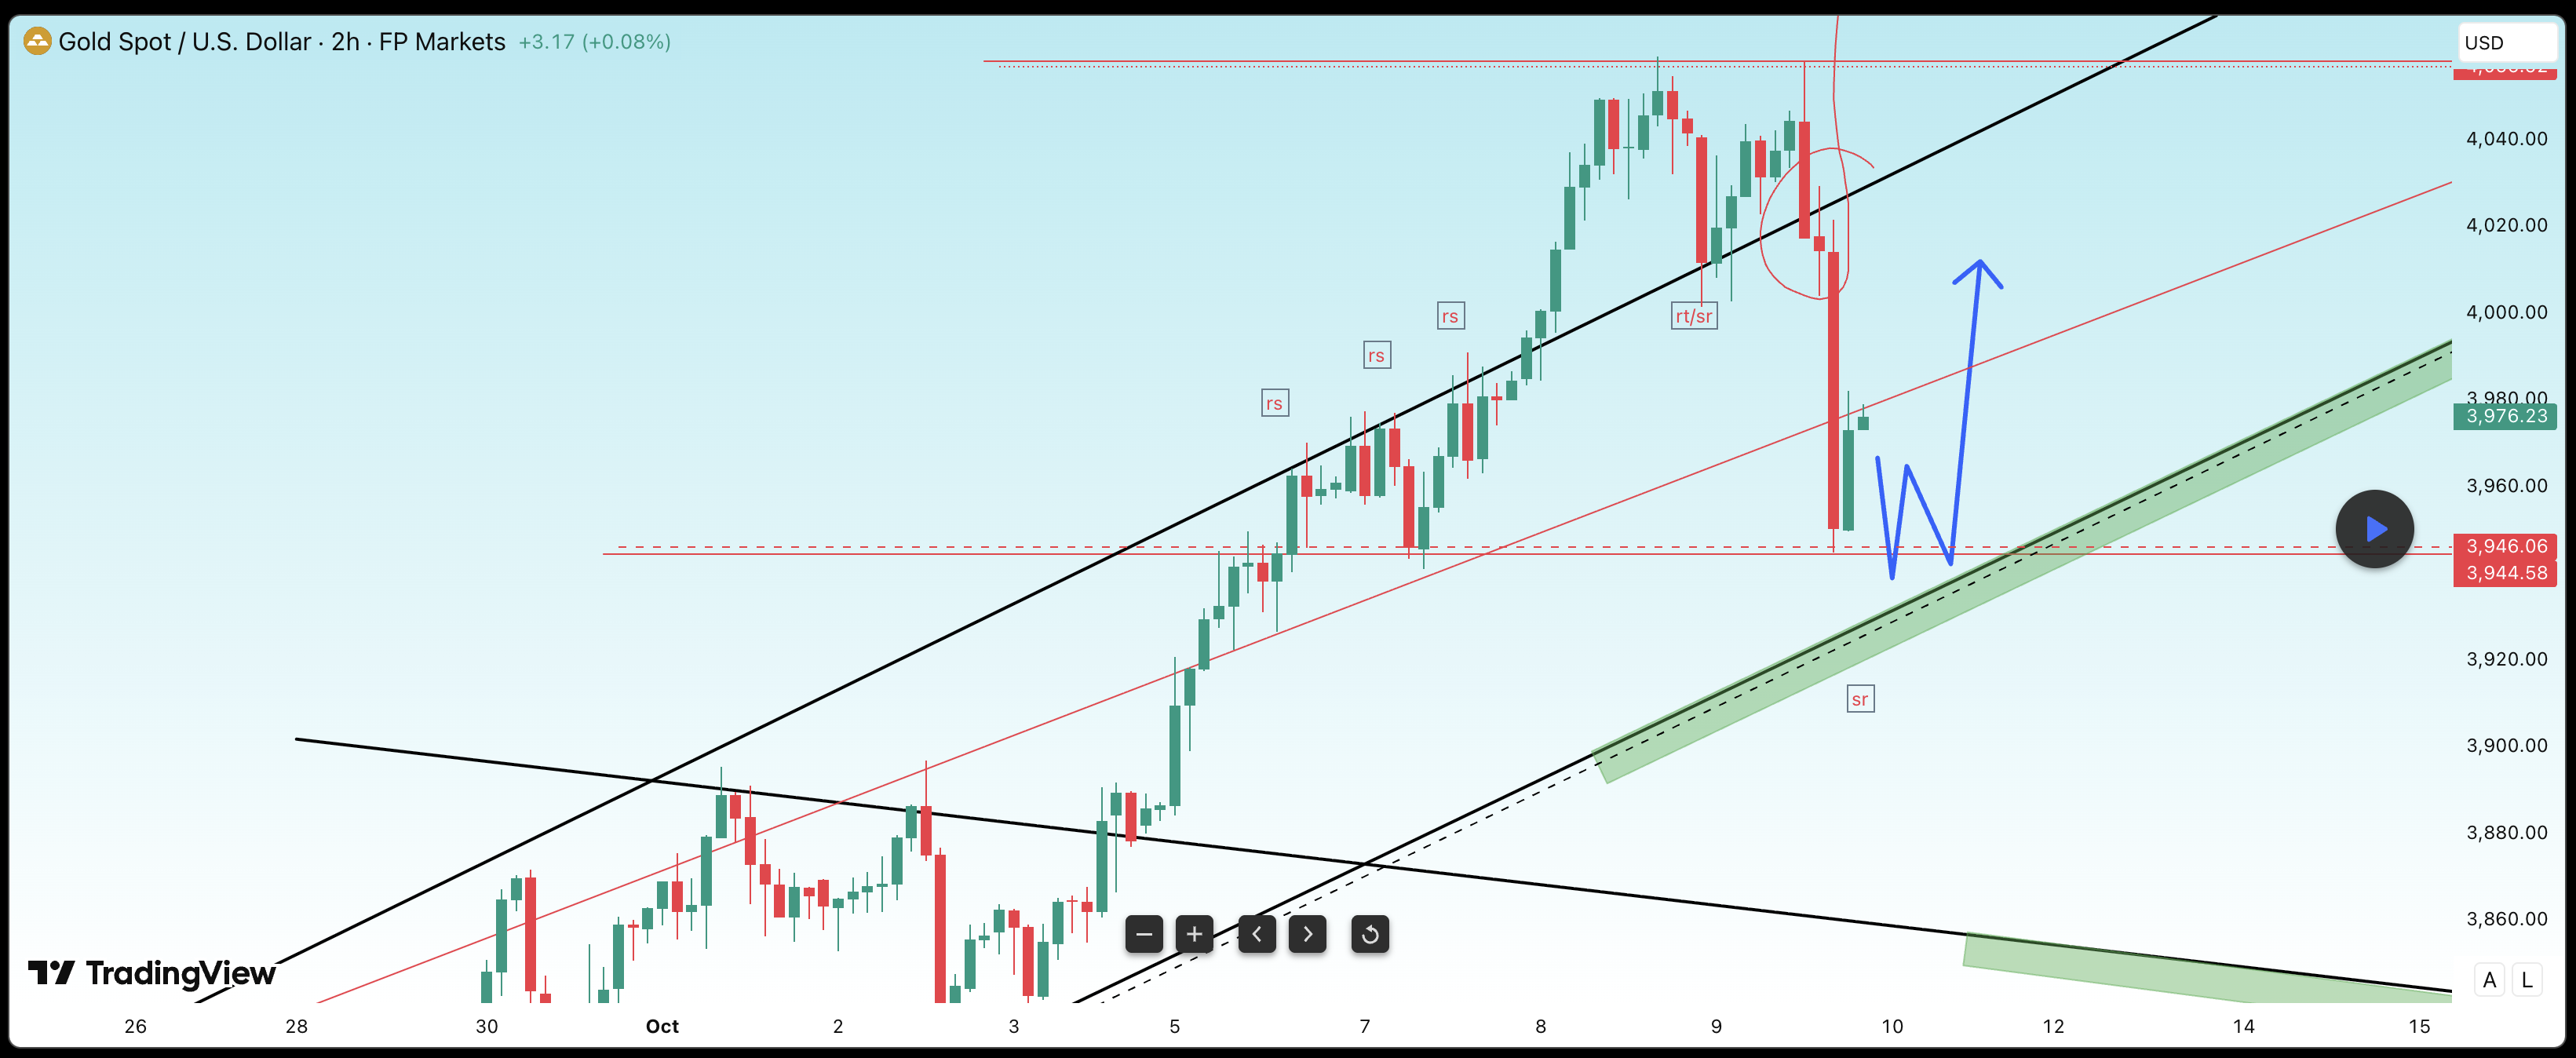
H1 Chart Deconstruction and Momentum Reset
The provided 1-hour chart captures the severity of the profit-taking, showing a massive rejection from the $4,040-$4,042 area, moving down to consolidate near . This move represents a necessary technical cooling.
Analysis of short-term indicators confirms this exhaustion. The MACD (12, 26), visible on the chart, has crossed below its signal line and moved into negative territory (Value: ).12 Similarly, the 14-period Relative Strength Index (RSI) registers , firmly in the “Sell” range but significantly above the oversold threshold of 30.12
The convergence of short-term sell signals (MACD, RSI) confirms that the aggressive pullback was justified and successful in resetting the market’s overbought condition. The immediate $3,970.00 level is identified as the critical short-term pivot.3 Holding this level is non-negotiable for the immediate continuation of the uptrend structure.
Tactical Entry Point Rationale
The entry selection is refined to , slightly below the established pivot. This strategic placement anticipates a high-probability technical maneuver often executed by large trading algorithms: the brief push below a key support level to trigger stop-loss orders of early dip buyers—a pattern known as a “spring” or liquidity grab. By placing the limit order at , the strategy aims to capture the price reversal at a superior discount immediately following this short-term liquidation event.
Conversely, the Take Profit 2 (TP2) target is set at . This level is strategically placed just below the established major weekly resistance zone of $4,084–$4,113.5 This conservative targeting significantly increases the probability of trade fulfillment before the market meets its structural ceiling, mitigating the risk of rejection or slippage that often occurs exactly at major resistance levels.
VI. Session Optimization and Volatility Timing
Effective execution of the XAU/USD signal on October 10, 2025, requires precise timing to align with peak liquidity and volatility.
Dominance of the New York Session
The highest market activity for XAU/USD occurs during the North American trading session (New York, 13:00 – 21:00 GMT / 9:00 AM – 5:00 PM ET).4 Gold’s pricing is heavily sensitive to US economic news, interest rate expectations, and US Dollar flow.4
The most potent time for trade entry is the period of the London and New York session overlap (13:00 – 17:00 GMT).4 This four-hour window features the maximum institutional liquidity, providing the necessary depth for the price to execute a clean reversal from the $3,968.00 limit entry.
Strategic Timing for October 10 Execution
The decision to delay execution until 13:00 GMT on October 10 is paramount. Trading during the lower volume Sydney/Tokyo sessions (Asian session) or the less volatile early London session would introduce unnecessary risk of false breakouts or being trapped by sideways consolidation.
By waiting for the New York open, the strategy ensures that the market’s reaction is driven by the deepest pockets of institutional capital, confirming their willingness to buy the support zone after fully processing the dovish implications of the previous days’ Fed announcements.7 This patience is critical; the liquidity event provided by the US market is required to supply the strong upward force necessary to break the current short-term bearish momentum.
VII. Detailed Trading Signal and Risk Management Strategy (10 October 2025)
The tactical long signal is initiated as a Buy Limit order, capitalizing on the temporary technical dip within the context of a confirmed structural bull market.
Precision Trade Parameters
| Parameter | Value ($/oz) | Explanation of Risk Management |
| Trade Type | Buy Limit | Entry is placed below the current market price ($3,974.21) to maximize the risk/reward ratio. |
| Entry Price | $3,968.00 | Chosen to capture a likely liquidity sweep below the $3,970 immediate pivot. |
| Stop Loss (SL) | $3,938.00 | Provides a calculated $30.00 price buffer. This level is strategically placed below the established $3,920 structural support.3 A breach of $3,938.00 signals a failure of the current technical structure, warranting immediate exit and validating a deeper correction towards $3,859.00. |
| Take Profit 1 (TP1) | $4,028.00 | Secure profit target, requiring a $60.00 move (2:1 R/R). Represents a return to the midpoint of the high-volatility range and a full retracement up to the breakdown zone. Fifty percent of the position should be closed here. |
| Take Profit 2 (TP2) | $4,078.00 | High-conviction continuation target, requiring a $110.00 move (3.66:1 R/R). Placed just under the major structural resistance confluence zone of $4,084–$4,113.5 |
Position Management Protocols
- Risk Allocation: Given the extreme volatility and recent record highs, capital allocation must remain conservative. A maximum of 1% of total trading capital should be risked on this trade, calculated based on the $30.00 stop distance.
- Trade Confirmation: The limit order must only be active during the optimal New York session timing (starting 13:00 GMT).
- TP1 Achievement: Upon the price reaching TP1 ($4,028.00), 50% of the position must be closed, and the Stop Loss for the remaining 50% must be immediately moved to the entry price ($3,968.00) to secure a risk-free position.
- Cross-Asset Monitoring: During the trade, continuous monitoring of US Treasury yields is required. A sharp decline in gold’s price concomitant with an unexpected spike in yields would serve as an early warning signal of structural risk, overriding the technical setup.
Contingency Planning
The contingency plan addresses the primary risk: the failure of the $3,970/$3,968 support cluster.
If the Stop Loss at $3,938.00 is triggered, it signals that the recent profit-taking was more aggressive and indicative of a deeper correction than initially assessed. The failure of this technical structure suggests that Leveraged Funds are liquidating at a rate that outpaces new institutional accumulation. In this scenario, all capital should be protected, and the market should be reassessed. Re-entry should only be considered if the price shows clear and sustainable defense of the next major support levels, namely the $3,850.00 – $3,900.00 cluster.5 The long-term fundamental support remains intact, but the tactical structure would require a full reset before another long position is initiated.
VIII. Conclusion
The XAU/USD market on October 10, 2025, presents a tactically superior opportunity to enter a long position congruent with a dominant, structurally sound bullish trend. The confluence of fundamental support (dovish Fed, geopolitical risk), a necessary technical exhaustion (MACD/RSI reset), and suggestive COT index data (indicating a recent cleansing of speculative positions) creates a high-probability scenario for a rebound.
The optimal strategy involves buying the dip near the critical $3,970 support, prioritizing execution during the high-liquidity New York session to ensure institutional confirmation. Adherence to the stipulated risk parameters—specifically the tight $3,938.00 Stop Loss placed below the $3,920 structure—is mandatory to manage the elevated volatility inherent in a commodity testing historical highs. This tactical long setup provides an asymmetric risk/reward profile, targeting the next major structural resistance cluster between $4,078.00 and $4,113.00.
Works cited
- Gold Outlook Q4 2025 – FOREX.com, accessed on October 10, 2025, https://www.forex.com/en-us/news-and-analysis/gold-outlook-q4-2025/
- A new high? | Gold price predictions from J.P. Morgan Research, accessed on October 10, 2025, https://www.jpmorgan.com/insights/global-research/commodities/gold-prices
- XAU/USD Gold Price Analysis Today: Gold Trading Continues to Gain Positive Momentum, accessed on October 10, 2025, https://www.dailyforex.com/forex-technical-analysis/2025/10/xau-usd-gold-price-analysis-today-09-october-2025/235264
- Best Time to Trade Gold – JustMarkets, accessed on October 10, 2025, https://justmarkets.com/trading-articles/commodities/best-time-to-trade-gold
- Gold Price Forecast: XAU/USD Hits Records- Eight Week Rally Runs Hot – FOREX.com, accessed on October 10, 2025, https://www.forex.com/en-us/news-and-analysis/gold-price-forecast-xau-usd-hits-records-eight-week-rally-runs-hot-10-8-2025/
- This New Gold Price Prediction From Goldman Sachs Suggests Precious Metal Can Surge to $5,000 – Finance Magnates, accessed on October 10, 2025, https://www.financemagnates.com/trending/this-new-gold-price-prediction-from-goldman-sachs-suggests-precious-metal-can-surge-to-5000/
- Economic Release Calendar – CME Group, accessed on October 10, 2025, https://www.cmegroup.com/education/events/economic-releases-calendar.html
- Gold Forecast & Price Prediction for Q4 2025 and 2026 – NAGA, accessed on October 10, 2025, https://naga.com/en/news-and-analysis/articles/gold-price-prediction
- COT Report Gold – Commitments of Traders | MarketBulls, accessed on October 10, 2025, https://market-bulls.com/cot-report-gold/
- Week Ahead Economic Events: 6 October – 10 October 2025 | Plus500, accessed on October 10, 2025, https://us.plus500.com/newsandmarketinsights/week-ahead-economic-events-october-6-2025
- Will Gold Price Hit $4500 on Fed Minutes Today?, accessed on October 10, 2025, https://www.ebc.com/forex/will-gold-price-hit-4-500-on-fed-minutes-today
- XAU USD Technical Analysis – Investing.com, accessed on October 10, 2025, https://www.investing.com/currencies/xau-usd-technical
Leave a Reply