I. Executive Summary and Actionable Signal
This report assesses the XAU/USD (Gold Spot) hourly (H1) chart, which is currently undergoing a sharp correction from recent highs, against a backdrop of profoundly bullish long-term market fundamentals. The analysis concludes that the dominant trend remains bullish, positioning the current price action as a high-probability opportunity for a trend continuation trade.
1.1. Actionable Signal: CONDITIONAL BUY (Continuation)
The definitive signal is a Conditional Buy, predicated on the market finding firm support at a critical technical level following the current pullback. The trade is justified by the strong structural uptrend combined with overwhelming fundamental support for gold prices in the medium to long term.
Execution is strictly conditional upon the market producing a confirmed bullish reversal signal directly at the established support zone.
| Parameter | Condition / Value | Rationale |
| Trade Type | Conditional Buy | Buying a pullback within a powerful, fundamentally supported uptrend. |
| Entry Zone | Near $3,820 – $3,830 | Requires price validation at this key technical support level.1 |
| Confirmation | Mandatory: H1 candle close forming a bullish reversal pattern (e.g., Hammer, Bullish Engulfing) in the Entry Zone.3 | Confirms demand has re-entered the market and selling momentum is absorbed.4 |
| Stop-Loss (SL) | Below the structural swing low (e.g., $3,815.00 approx.) | Invalidation point where the corrective pullback turns into a structural reversal.1 |
| Target 1 (T1) | $3,885.00 – $3,900.00 | Re-test of the recent swing high resistance. |
| Long-Term Target | $4,000.00 | Aligned with fundamental forecasts for mid-2026. |
II. Technical Analysis: Current Price Structure
The current H1 chart reveals a well-defined price structure that favors continuation over reversal, provided the key support level holds.
2.1. Trend and Correction Characterization
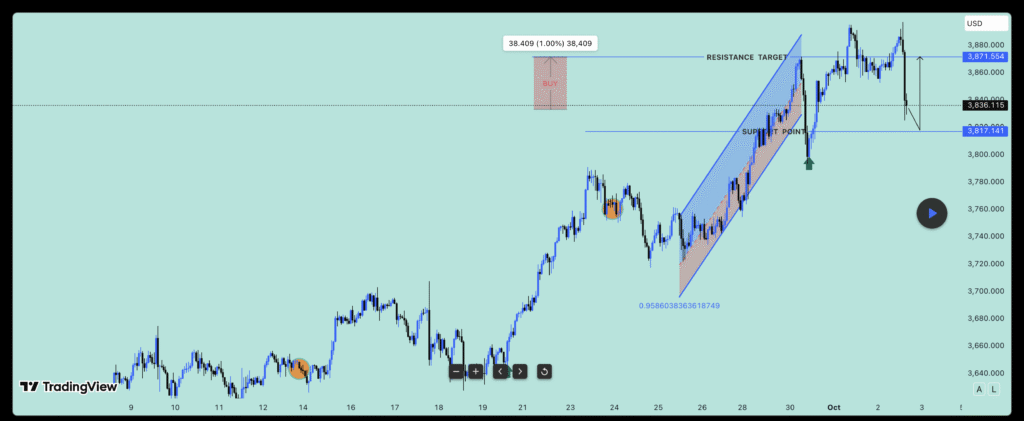
- Dominant Trend: The price action leading up to the recent high (near $3,900) clearly established a robust multi-day uptrend, characterized by a series of higher highs and higher lows.
- Correction Character: The subsequent sharp decline is categorized as a Pullback—a temporary dip or pause against the prevailing upward trend.2 For trend-following strategies, pullbacks offer the optimal entry point at a discount.2 The sharpness of the drop highlights aggressive profit-taking or supply, but it remains a buying opportunity unless the structural support fails.2
- Support Identification: The price is currently testing a critical area of static support around $3,820 – $3,830. This level is a high-demand concentration zone, acting as a potential floor where buyers are expected to step back in.1
2.2. Momentum Analysis using MACD
The Moving Average Convergence Divergence (MACD) indicator confirms the momentum dynamics typical of a strong pullback:
- MACD Line Crossover: The MACD line (Blue) has recently crossed below the Signal line (Orange). This is technically a short-term bearish signal.5 However, in the context of a strong overarching uptrend, this crossover primarily confirms the
intensity of the corrective move (the pullback), rather than signaling a full trend reversal. - Histogram and Momentum Exhaustion: The MACD Histogram bars are now negative (red) and appear to be short or flattening at the bottom of the structure.6 This
contraction in the histogram is crucial, as it signals that the selling pressure and bearish momentum are quickly fading or pausing.7 This momentum exhaustion suggests the pullback is nearing its completion, setting the stage for a reversal back to the upside.6
2.3. Confirmation via Price Action
Relying solely on the MACD crossover or support level is risky. Therefore, entry must be validated by price action:
- Required Signal: A confirmed close of a high-conviction bullish reversal pattern (such as a Hammer or Bullish Engulfing) on the H1 chart is required to confirm that actual demand has returned to absorb the remaining supply at the $3,820 – $3,830 support zone.3 A Stop Buy Entry Order placed above this confirmation candle ensures the trade is only triggered if momentum immediately follows through to the upside.2
III. Fundamental Analysis: The Bullish Structural Backdrop
The technical signal to “Buy the Dip” is overwhelmingly supported by the fundamental outlook for Gold (XAU/USD) in Q4 2025 and 2026. Global Research forecasts indicate a continued structural bull case for gold.
3.1. Monetary Policy and Interest Rates (Fed Action)
The outlook for monetary policy in the US remains dovish, creating an ideal environment for non-yielding assets like gold:
- Rate Cuts in 2025/2026: The Federal Reserve cut interest rates in September 2025 (to the 4.00%–4.25% range) and is widely expected to implement further rate cuts into 2025 and 2026.
- Impact on Gold: Expected looser monetary policy and lower interest rates reduce the opportunity cost of holding gold, making it more attractive relative to interest-bearing assets like bonds. This expectation is a primary supportive factor for the current bullish trajectory.
3.2. Central Bank Demand and Haven Status
Institutional and central bank actions continue to drive structural demand:
- Strong Central Bank Demand: Central bank buying has remained robust, topping 1,000 tonnes for the third year in a row in 2025. This strong institutional appetite provides a reliable floor for gold prices.
- Haven Demand: Gold is currently performing its traditional role as a store of value and haven asset. Rising geopolitical tensions, global economic slowdown fears, and trade uncertainty are driving investors to shift capital out of riskier assets and into gold.
3.3. Price Forecasts
Fundamental forecasts indicate strong upside potential, validating the long-term bullish bias:
- Q4 2025 Outlook: The gold outlook remains bullish, with many analysts suggesting the rally could carry through to year-end, targeting the $4,000 per ounce milestone. Prices are expected to average $3,675/oz by the final quarter of 2025.
- 2026 Forecast: The long-term bias remains strongly positive, with prices projected to climb toward $4,000/oz by mid-2026.
IV. Execution Plan and Risk Mitigation
4.1. Execution Strategy
The entry strategy will be non-aggressive, prioritizing confirmation over speed:
- Monitor: Watch the H1 chart for a bullish reversal candlestick pattern to close firmly within the $3,820 – $3,830 support zone.3
- Execute: Place a Stop Buy Entry Order slightly above the high of the confirmed bullish candle close to ensure immediate bullish follow-through.2
- Risk Management: The Stop-Loss must be placed below the structural support at $3,815.00. This is the precise point of trade invalidation.1
4.2. Risk Assessment and Mitigation
| Risk Category | Description of Risk | Likelihood | Impact | Mitigation Plan/Action |
| Technical Failure | The pullback turns into a full structural reversal, breaching SL. | MEDIUM | HIGH | Immediate, non-negotiable exit upon SL hit ($3,815.00). Re-evaluate trend bias to Bearish.9 |
| Timing Error | Premature entry before demand is confirmed by price action. | MEDIUM | MEDIUM | Strictly wait for the H1 confirmation candle to close before placing the Stop Buy Entry order.2 |
| Momentum Stalling | Price fails to continue after entry, leading to sideways consolidation. | MEDIUM | LOW | If consolidation persists near entry, move the SL to breakeven quickly to protect capital. |
Works cited
- accessed on September 30, 2025, https://www.investopedia.com/trading/support-and-resistance-basics/#:~:text=Support%20occurs%20at%20the%20point,using%20trendlines%20and%20moving%20averages.
- Pullback: What It Means in Trading, With Examples – Investopedia, accessed on September 30, 2025, https://www.investopedia.com/terms/p/pullback.asp
- How to Use Candlestick Patterns for Pullback Signals – LuxAlgo, accessed on September 30, 2025, https://www.luxalgo.com/blog/how-to-use-candlestick-patterns-for-pullback-signals/
- How to Use the MACD Indicator for Profitable Trades, accessed on September 30, 2025, https://highstrike.com/macd-trading-strategy/
- MACD Indicator Explained: Complete Guide to MACD Line, Signal Line, Histogram, Crossover, Zero Line – Mind Math Money, accessed on September 30, 2025, https://www.mindmathmoney.com/articles/understanding-the-macd-indicator-macd-line-signal-line-histogram-crossover-and-zero-line
- When To Use And How To Read The MACD Indicator – Commodity.com, accessed on September 30, 2025, https://commodity.com/technical-analysis/macd/
- MACD Histogram – Knowledge base – cTrader Help Centre, accessed on September 30, 2025, https://help.ctrader.com/knowledge-base/indicators/oscillators/macd-histogram/
- Candlestick Confirmation: Key Techniques – LuxAlgo, accessed on September 30, 2025, https://www.luxalgo.com/blog/candlestick-confirmation-key-techniques/
- FY-2023-Risk-Analysis-Template.docx – State Department, accessed on September 30, 2025, https://www.state.gov/wp-content/uploads/2023/01/FY-2023-Risk-Analysis-Template.docx
Leave a Reply