1. Executive Summary: High-Conviction Signal and Integrated Rationale
The XAU/USD market has recently undergone a severe, yet necessary, technical correction following its historic run. Gold surged over 60% year-to-date, hitting an all-time high (ATH) of $4,381 per ounce in early October 2025.1 This extraordinary rally culminated in an 8% correction, its steepest single-day decline in over a decade.3 Analysis indicates that while this plunge was technically traumatic—driven by long-side liquidation and profit-taking—the fundamental and sentimental tailwinds remain structurally intact, positioning the current price level as a strategic accumulation zone.
The long-term case for gold is supported by the early stages of a Federal Reserve (Fed) rate cutting cycle 4, persistent geopolitical instability 6, and critical warnings regarding systemic vulnerabilities in private credit markets.8 Sentiment has shifted from “overbought” to “under owned” 2, suggesting the speculative slate has been cleansed.
The immediate technical picture (H1 chart) shows the price having briefly violated the critical $4,000 psychological support. This temporary breach presents a high-risk, high-reward counter-trend setup based on the anticipation of a failed breakdown (a bear trap) and a sharp snap-back rally toward prior resistance.
Strategic Trading Recommendation (XAU/USD)
The overall market structure favors initiating a Long position, capitalizing on the structural re-entry opportunity near the immediate low.
Table 4: XAU/USD Actionable Trade Plan Summary
| Parameter | Value | Risk/Reward |
| Signal Direction | Buy (Long) | |
| Entry Zone (Aggressive) | $3,965 – $3,995 | |
| Primary Stop Loss (SL) | $3,920 | |
| Target Profit 1 (TP1) | $4,180 | 1:6.1 (Approx.) |
| Target Profit 2 (TP2) | $4,265 | 1:8.5 (Approx.) |
| Key Invalidation | Sustained close below $3,920 | |
| Key Confirmation | Sustained close above $4,022 |
2. Part I: Foundational Macro and Monetary Policy Analysis (Fundamental Pillar)
2.1. The Federal Reserve Policy Pivot and Gold’s Response
The primary fundamental tailwind for gold is the shifting monetary policy stance of the US Federal Reserve. The Fed initiated a rate cut in September 2025, which was the first such reduction in nine months. Key officials, such as San Francisco Fed President Mary Daly, have publicly supported this move and anticipate further reductions.4 J.P. Morgan Global Research forecasts two more rate cuts before the end of 2025.5
Historically, gold demonstrates its strongest performance during the early phase of Fed rate cut cycles.4 This phenomenon is chiefly driven by the declining opportunity cost of holding non-yielding assets, making gold significantly more attractive as interest rates fall.5 Although the September cut was characterized as an “insurance cut” by Fed Chair Jerome Powell, aimed at managing risks to the labor market rather than signaling a full recessionary cycle, the anticipation of continued policy accommodation strengthens the gold outlook.5 Even in a scenario of non-recessionary easing, gold is expected to provide diversification and positive returns, historically leading average returns alongside major equity indices during mid-cycle adjustments.5
The current macroeconomic backdrop introduces a complex risk factor related to policy coordination. The Fed’s aggressive response during the pandemic, coupled with unprecedented fiscal expansion, amplified inflation concerns and created significant volatility in the gold market.4 Currently, the US government shutdown has delayed the release of critical September CPI data.9 If the Fed proceeds with further rate cuts while fiscal instability persists and government debt remains high, it reignites long-standing investor concerns regarding fiat currency debasement. While some analysts initially cited geopolitical and fiat debasement fears as “old news” 11, the convergence of ongoing Fed easing, high debt, and fiscal instability grants these concerns new and immediate relevance, amplifying the structural case for gold as a hedge against currency uncertainty.
2.2. Intermarket Dynamics: The Dollar and Real Yield Nexus
Gold’s immediate price action is highly sensitive to the US Dollar Index (DXY). Following the recent market correction, the DXY has held firm near the 99 level.10 This dollar strength presents a direct headwind for gold, which is dollar-priced.1 A major factor cited for gold’s recent sharp decline was the collective view taken by delegates at the IMF/World Bank meetings who upgraded their forecast for the US growth cycle.11 An improved outlook on US growth reduces the urgency for aggressive Fed dovishness and tempers recessionary fears, thereby supporting the dollar and temporarily undermining the core investment case for gold as a deep-recession hedge. The market is currently balancing this US growth resilience against the expected path of Fed rate cuts.
However, the long-term resilience of gold is anchored by the direction of US Treasury real yields (nominal yields adjusted for inflation). The medium-term uptrend in gold is confirmed by the sustained downtrend in the 10-year US Treasury real yield, which remains below 1.87%.3 Despite temporary dollar strength, if inflationary pressures persist (a probability factored into current market expectations while awaiting the delayed CPI report 10), continued Fed rate cuts will decrease nominal yields further. This dynamic forces real yields lower, which remains the decisive factor supporting gold’s upward trajectory, demonstrating why the metal’s long-term shine is considered far from dimmed.3
2.3. Systemic Risks and Geopolitical Haven Demand
Geopolitical and systemic risks provide the enduring safety premium for gold. Global tensions stemming from ongoing conflicts in Eastern Europe and the Middle East, coupled with sanctions imposed on major oil producers, continue to maintain a structural safe-haven premium for precious metals.6 Energy market disruptions often coincide with increased geopolitical tensions and fuel inflation expectations, benefiting gold through multiple transmission mechanisms.6
Beyond explicit geopolitical events, warnings from financial regulators signal latent systemic risks that support gold’s long-term position. The Governor of the Bank of England, Andrew Bailey, has issued stern warnings about vulnerabilities in the non-bank lending and private credit sectors, citing “worrying echoes of the sub-prime mortgage crisis that kicked off the global financial crash of 2008”.8 These opaque markets are characterized by high leverage, complexity, and potentially weak underwriting standards.8 The transfer of risk away from regulated banking sectors toward these private markets presents a structural threat to stability.8 Gold’s traditional role is to hedge against such financial tail risks. The persistent nature of these high-level regulatory warnings ensures that the systemic risk premium is embedded in gold’s price floor, making deep, prolonged bear markets unlikely unless these foundational financial vulnerabilities are resolved.
Table 1: XAU/USD Macro Headwinds and Tailwinds Matrix (Q4 2025)
| Driver Category | Factor | Impact Direction | Strength/Significance | Source Reference |
| Monetary Policy | Fed Rate Cuts (Insurance/Early Cycle) | Positive (+) | High (Structural, lower opportunity cost) | 4 |
| Intermarket | Strengthening USD (DXY near 99) | Negative (-) | Moderate (Immediate friction against XAU) | 10 |
| Systemic Risk | Private Credit/Non-Bank Vulnerabilities | Highly Positive (++) | High (Structural hedge against financial crisis) | 8 |
| Geopolitics | Conflicts, Energy Sanctions | Positive (+) | High (Safe-haven premium maintained) | 6 |
3. Part II: Institutional Flows and Market Positioning (Sentimental/COT Pillar)
3.1. Analysis of the Commitment of Traders (COT) Data and Speculative Positioning
Prior to the massive sell-off, the gold market exhibited signs of being heavily crowded. The CFTC Gold speculative net position (Non-Commercial category) stood at a net long of 266.7K contracts as of September 26, 2025.14 Non-Commercial traders, often referred to as large speculators, tend to amplify existing price trends.15 This substantial net long positioning indicated an overbought condition leading into the $4,381 peak.
The ensuing 8% price plunge was a classic leveraged liquidation event, forcing the closure of many of these long positions via mass stop-runs and profit-taking.1 This sharp correction served as a crucial ‘cleansing’ mechanism, significantly reducing the excessively crowded long positioning that had built up during the 60%+ year-to-date rally. This process is essential for establishing a technically healthier market base capable of supporting the next leg of the advance. Following this major correction, there is a growing consensus among financial experts that gold is “no longer overbought but remain under owned in portfolios”.2 This critical shift in sentiment from market experts suggests that institutional capital has completed its necessary tactical reset and is now actively seeking a low-risk, strategic re-entry point, thereby validating the current dip as a prime accumulation opportunity.2
3.2. Volatility and Liquidity Dynamics
The market’s ability to absorb the sharp October selling pressure highlights strong underlying liquidity. COMEX Gold Futures Open Interest, which represents the total number of outstanding contracts, increased to 528,789, representing a 2.43% rise from the preceding week.18 Open interest increasing during a price decline indicates that strong liquidity absorption occurred, meaning new long positions (accumulation) or short covering was offset by new short entries. This confirms significant re-engagement and strong liquidity absorption at the lower price levels, suggesting market participants view this area as a relevant battleground for establishing a new short-term equilibrium.
Furthermore, the CBOE Gold ETF Volatility Index (GVZ) remains elevated at 24.75.19 This high level of volatility reflects the recent sharp price turbulence but is also characteristic of markets that are searching for an inflection point or a new short-term base, often preceding significant reversals. Importantly, the market’s foundational base is reinforced by persistent central bank demand. Central bank gold purchases are strategic and long-term, providing a non-sensitive price floor that is less vulnerable to the short-term speculative volatility witnessed in the private investment sector.4
Table 2: Key Market Sentiment Indicators (Post-Correction)
| Indicator | Latest Value | Trend/Context | Interpretation for XAU/USD | Source Reference |
| Non-Commercial Net Longs | 266.7K (Pre-Plunge) | Overheated / Cleansed | Positions significantly reduced by liquidation; reset required for sustainable rally. | 1 |
| Open Interest (COMEX) | 528,789 (Up 2.43% WoW) | Absorption/Re-engagement | Liquidity is strong; new institutional activity absorbed the plunge. | 18 |
| Volatility (GVZ) | 24.75 | Elevated | High price turbulence, typical of a market seeking a new short-term equilibrium. | 19 |
| Analyst Sentiment | ‘Under-Owned’ | Bullish Recalibration | Confirms the dip as a strategic accumulation opportunity. | 2 |
4. Part III: XAU/USD Technical Structure and Price Action Deep Dive (Technical Pillar)
4.1. Long-Term Structure and the Significance of the $4,381 Peak
The recent price action confirms the $4,381 level as a significant structural peak, achieved during a momentum-fueled, record-shattering rally.2 The ensuing correction, involving a drop of over $300 per ounce, was a technical ‘shakeout’ designed to reset momentum.1 The selling pressure intensified when the price broke decisively below the previous support range of $4,186–$4,219.16 The violence of the decline confirms that high-leveraged long positions were successfully liquidated, establishing a clearer technical picture for the next phase of accumulation. The scale of the correction, while dramatic, has recalibrated overheated prices rather than signaling a reversal of the robust multi-year uptrend.2
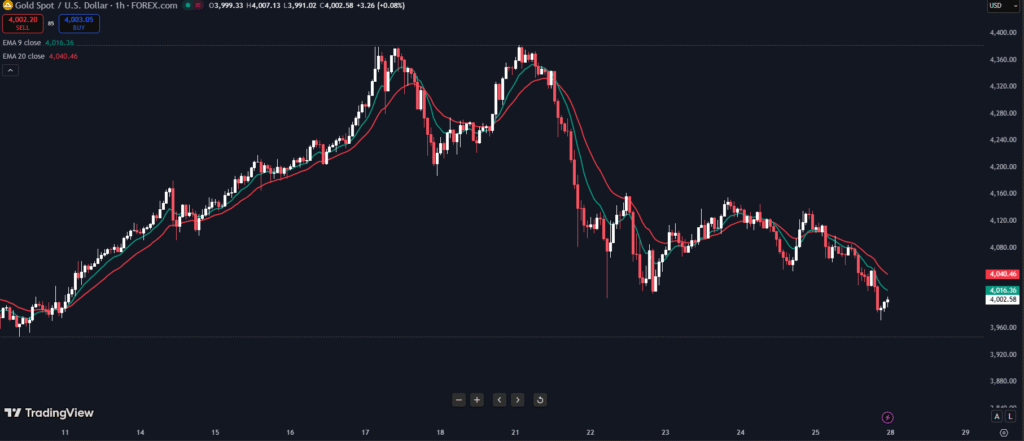
4.2. Near-Term Chart Interpretation and Moving Average Analysis
Detailed examination of the recent price action (H1 chart) reveals that gold is under immediate, short-term bearish pressure, with the price trading consistently below the short-term Exponential Moving Averages (EMA 9 and EMA 20). The analysis confirms the price has dipped below the critical $4,000–$4,022 support zone, which previously coincided with the 21-day EMA and the base of the last major breakout.16 The current price point, observed near $3,985 on the chart, constitutes a short-term violation of this crucial psychological and technical floor. While this violation shifts the immediate technical momentum toward bearishness, it simultaneously creates the ideal condition for a counter-trade, leveraging the high-conviction structural support identified near the $4,000 level.
4.3. Defining Key Support and Resistance Levels (SL/TP Justification)
Defining precise entry and exit points is critical given the recent volatility.
Key Technical Levels:
Table 3: XAU/USD Key Technical Levels and Action Zones
| Level Designation | Price Zone (US$/Oz) | Significance and Trade Action |
| R2 (Structural Peak) | $4,380 – $4,455 | All-time high zone / Medium-term profit target |
| R1 (Liquidation Trigger) | $4,186 – $4,267 | Key pivot point / TP2 Target |
| S1 (Psychological/EMA) | $4,000 – $4,022 | Immediate major support (currently breached) / Confirmation level for short-term longs |
| S2 (SL Anchor) | $3,920 | Invalidation point / Stop Loss placement |
| Current Price (H1) | ~$3,985 | Testing new low following the $4,000 breach |
The entry zone ($3,965–$3,995) targets the immediate low following the breakdown, capitalizing on the high probability of a mean reversion bounce.
The Primary Stop Loss (SL) is placed decisively at $3,920. This level sits beneath the low of the current swing structure. A sustained closure below $3,920 would confirm a significant technical failure of the $4,000 base, invalidating the “buy the dip” thesis and suggesting a deeper structural correction toward $3,800 is imminent.
Target Profit 1 (TP1) is set at $4,180. This target is positioned just below the R1 consolidation zone ($4,186–$4,267), allowing for profit realization near the area where the initial liquidation began.16
Target Profit 2 (TP2) is established at $4,265. This level aims for the upper boundary of the critical structural breakdown zone, which, if successfully reclaimed, would signal a definitive reversal and a likely trajectory back toward the ATH of $4,381.3
5. Part IV: Strategic Trade Execution and Risk Management Framework
The integrated analysis—where strong fundamental tailwinds (Fed easing, systemic risks) converge with a sentiment reset (under-owned positioning) and a temporary technical breakdown—creates a highly asymmetric risk/reward opportunity for a long position.
The Signal Direction is Long (Buy), entering aggressively into the current low range ($3,965–$3,995) to exploit the favorable structural positioning. This trade operates as a medium-term reversal play, anticipating that the structural factors will quickly override the short-term technical breach.
Risk management is central to this high-conviction trade. The use of a tight but structurally sound stop loss at $3,920 ensures that capital preservation is prioritized if the downside momentum accelerates. With a potential risk of approximately $35 per ounce (Entry $3,965 to SL $3,920) versus a maximum reward potential of approximately $300 per ounce (Entry $3,965 to TP2 $4,265), the resulting Risk/Reward ratio of approximately 1:8.5 is exceptionally favorable, justifying the aggressive entry near the structural pivot.
Conclusion
The current positioning in XAU/USD represents a classic scenario where structural macro factors provide immense leverage against temporary speculative turmoil. The recent 8% correction has successfully flushed out over-leveraged long positions, while the fundamental outlook—driven by an emerging Fed rate cut cycle, persistent geopolitical risk, and heightened concerns regarding non-bank systemic financial risk—remains robustly bullish. The short-term breach of $4,000 presents a tactical entry point. Execution of the long signal with precise adherence to the $3,920 Stop Loss is crucial for managing the immediate downside risk while maximizing exposure to the market’s probable structural recovery and continuation of the long-term uptrend toward new record highs.
Works cited
- Gold’s price is plunging. Here’s why (and what investors should do next). – CBS News, accessed on October 27, 2025, https://www.cbsnews.com/news/golds-price-is-plunging-heres-why-and-what-investors-should-do-next/
- Precious Metals Poised for Resurgence: Gold and Silver ‘Under-Owned’ and Primed for Renewed Investor Interest – FinancialContent, accessed on October 27, 2025, https://markets.financialcontent.com/wral/article/marketminute-2025-10-22-precious-metals-poised-for-resurgence-gold-and-silver-under-owned-and-primed-for-renewed-investor-interest
- Gold (XAU/USD): Short-term bullish reversal triggered after 8% sell-off – MarketPulse, accessed on October 27, 2025, https://www.marketpulse.com/news/gold-xauusd-short-term-bullish-reversal-triggered-after-8-sell-off/
- Gold Prices Soar Amid Federal Reserve’s 2025 Policy Shift – Discovery Alert, accessed on October 27, 2025, https://discoveryalert.com.au/news/gold-fed-policy-relationship-insights-2025/
- What’s The Fed’s Next Move? | J.P. Morgan Research, accessed on October 27, 2025, https://www.jpmorgan.com/insights/global-research/economy/fed-rate-cuts
- Gold Market Correction 2025: Understanding the Sharp October Decline – Discovery Alert, accessed on October 27, 2025, https://discoveryalert.com.au/news/gold-market-correction-2025-triggers-dynamics/
- Gold prices surge globally: Exploring the factors behind the rise and market drivers, accessed on October 27, 2025, https://www.nationthailand.com/business/trading-investment/40057289
- Gold on track for biggest one-day fall since 2020; BoE governor …, accessed on October 27, 2025, https://www.theguardian.com/business/live/2025/oct/21/uk-borrowing-outstrips-forecasts-reeves-amazon-web-services-outage-resolved-bank-of-england-stock-markets-business-live-news
- Gold cools from record highs on profit-taking, focus shifts to US inflation data, accessed on October 27, 2025, https://www.financialexpress.com/market/gold-pulse/gold-cools-from-record-highs-on-profit-taking-focus-shifts-to-us-inflation-data/4017816/
- United States Dollar – Quote – Chart – Historical Data – News – Trading Economics, accessed on October 27, 2025, https://tradingeconomics.com/united-states/currency
- Here’s a theory on why gold suffered its biggest one-day fall in more than ten years, and it’s linked to the U.S. economy. | Morningstar, accessed on October 27, 2025, https://www.morningstar.com/news/marketwatch/20251022149/heres-a-theory-on-why-gold-suffered-its-biggest-one-day-fall-in-more-than-ten-years-and-its-linked-to-the-us-economy
- USDJPY, Gold Outlook: Haven Strength on Hold – FOREX.com, accessed on October 27, 2025, https://www.forex.com/en-us/news-and-analysis/usdjpy-gold-outlook-haven-strength-on-hold/
- Gold price: First weekly loss in nine weeks as dollar strengthens, traders await US inflation data, accessed on October 27, 2025, https://www.businesstoday.in/personal-finance/investment/story/gold-price-first-weekly-loss-in-nine-weeks-as-dollar-strengthens-traders-await-us-inflation-data-499448-2025-10-24
- CFTC Gold speculative net positions – Investing.com, accessed on October 27, 2025, https://www.investing.com/economic-calendar/cftc-gold-speculative-positions-1618
- Gold COT Data: Latest Index – InsiderWeek, accessed on October 27, 2025, https://insider-week.com/en/cot/gold/
- Gold analysis: XAU/USD aims to stabilise after shakeout – City Index, accessed on October 27, 2025, https://www.cityindex.com/en-uk/news-and-analysis/gold-analysis-xau-usd-aims-to-stabilise-after-shakeout-2025-10-23/
- Gold’s Glitter Fades: Truist Signals a Sharp Correction, What Lies Ahead for the Precious Metal? – FinancialContent, accessed on October 27, 2025, https://markets.financialcontent.com/wral/article/marketminute-2025-10-22-golds-glitter-fades-truist-signals-a-sharp-correction-what-lies-ahead-for-the-precious-metal
- COMEX Gold Futures Open Interest (Weekly) – Historical Data… – YCharts, accessed on October 27, 2025, https://ycharts.com/indicators/comex_gold_futures_open_interest
- Gold ETF Volatility Index [GVZ] – MacroMicro, accessed on October 27, 2025, https://en.macromicro.me/charts/21527/gvz
Leave a Reply