1. Executive Intelligence Summary
1.1. The Market State: A Precarious Equilibrium
As global markets prepare for the opening of the Tuesday, November 25, 2025 session, the precious metals complex, specifically Gold (XAU/USD), finds itself suspended in a state of high-tension equilibrium. Trading within a historically elevated paradigm—oscillating comfortably above the psychological $4,000 per ounce threshold—the asset is currently caught between the opposing forces of a resurgent US Dollar (DXY) and persistent, structurally ingrained geopolitical instability.1 The immediate price action is characterized by a “wait-and-see” consolidation, with the spot price hovering near $4,065, pivoting around the 100-day moving average as traders digest the implications of a fractured Federal Reserve consensus and the looming US Thanksgiving holiday liquidity drain.2
The prevailing narrative has shifted dramatically in the last 72 hours. The market has moved from pricing in a near-certain interest rate cut at the December 2025 FOMC meeting to a far more ambiguous outlook, with probabilities deteriorating from 74% to approximately 33-50% in light of hawkish regional Fed commentary.3 This repricing of the monetary path has injected fresh volatility into the market, capping upside momentum near $4,130 while simultaneously testing the resolve of buyers at the $4,020 structural support.2
1.2. Strategic Outlook for November 25
The trading session on Tuesday, November 25, represents a critical juncture. It serves as the final liquidity gateway before the North American markets wind down for the Thanksgiving holiday break (Thursday, Nov 27). Consequently, the session is expected to be dominated by two distinct phases: an initial bout of high-volatility positioning in reaction to the Consumer Confidence and Richmond Fed Manufacturing data releases at 10:00 AM ET, followed by a potential liquidity vacuum and profit-taking into the close.3
For the astute market participant, the strategy is one of tactical bearishness within a broader bullish structure. The immediate headwinds—specifically the DXY trading near 6-month highs of 100.20 and the hawkish recalibration of rate expectations—favor selling rallies into the $4,090–$4,110 supply zone.7 However, the presence of a “war premium” and the potential for a “bad news is good news” reaction to the economic data necessitates a nimble approach, keeping buy orders active at deep value zones near $3,980.2
1.3. Signal Synopsis
- Primary Bias: Neutral-Bearish below $4,100 intraday.
- Key Catalyst: US Consumer Confidence Data (10:00 AM ET).
- Actionable Signal: Short Sell at $4,095 targeting $4,035; Buy Limit at $3,980 targeting $4,150.
- Volatility Warning: Expect “stop hunts” above $4,100 and below $4,050 due to pre-holiday thin liquidity.
2. Macroeconomic Fundamental Analysis
The valuation of Gold is never an isolated phenomenon; it is the inverse reflection of confidence in fiat currency, sovereign debt sustainability, and the trajectory of real interest rates. To understand the direction of XAU/USD for November 25, 2025, one must first dissect the macroeconomic drivers currently exerting pressure on the asset.
2.1. The Federal Reserve Policy Divergence
The single most significant driver of gold price action in late November 2025 is the sudden disintegration of the consensus regarding the Federal Reserve’s monetary policy path. Throughout the third quarter of 2025, the market had aggressively front-run a pivot toward easing. However, recent communications from the Federal Open Market Committee (FOMC) have introduced significant “hawkish noise,” dismantling the immediate bullish momentum for non-yielding assets like gold.
2.1.1. The “December Cut” Repricing Mechanism
The market is currently undergoing a painful repricing of the probability of a rate cut at the December 9-10, 2025 FOMC meeting.9 Just weeks ago, the probability of a 25-basis point cut stood at a robust 74%. However, data released leading up to November 25 has forced a recalibration, with the CME FedWatch Tool and analyst models now indicating that probability has collapsed to between 33% and 50%.3
This shift is not merely a numerical adjustment; it represents a fundamental change in the “cost of carry” for gold. Gold yields nothing. In a high-interest-rate environment, the opportunity cost of holding gold increases relative to short-term Treasuries. When the Fed signals that rates will remain “higher for longer” or that cuts are delayed, capital flows out of the zero-yield safe haven and into the yield-bearing Dollar. This mechanism is currently responsible for the heavy selling pressure observed in the $4,100–$4,130 resistance zone.2
2.1.2. The Williams-Logan Schism
The uncertainty is exacerbated by a visible split in the rhetoric of senior Fed officials, creating a confusing forward guidance landscape:
- The Dovish Camp: New York Fed President John Williams has recently described the current policy stance as “modestly restrictive,” a phrasing that markets initially interpreted as a signal that the “restrictive” phase was nearing its end, potentially opening the door for cuts.3
- The Hawkish Camp: Conversely, Dallas Fed President Lorie Logan has countered with hawkish tones, emphasizing that inflation risks remain asymmetric to the upside and that continued restrictive policy is necessary to ensure price stability does not unravel.3
This divergence—the “Williams-Logan Schism”—creates a volatility premium. Markets despise uncertainty. When the path of the world’s reserve currency is unclear, the default algorithmic response is often to reduce risk exposure, which in this cycle has manifested as selling both equities and gold in favor of the US Dollar cash position.11
2.2. The Data Vacuum: Fallout from the 43-Day Shutdown
A unique and critical variable in the November 2025 analysis is the lingering impact of the recent 43-day US government shutdown.12 This event has severed the continuous flow of economic data that algorithms and institutional desks rely on to price risk.
2.2.1. The “Blind Flying” Phenomenon
The shutdown caused significant delays in key reports, including the September Nonfarm Payrolls (NFP) and various inflation metrics. Even as the government reopens, there is a backlog of data, and the reliability of “catch-up” reports is often questioned. For instance, the October CPI release was cancelled entirely in some schedules, or delayed significantly, leaving the Fed to make decisions without fresh inflation data.10
- Implication: When data is missing or delayed, volatility increases because every subsequent data point is scrutinized with higher intensity. The market is “flying blind,” meaning the reaction to Tuesday’s Consumer Confidence report could be disproportionately violent as traders scramble to fill the information void. The shutdown has effectively lowered the liquidity threshold required to move the market, as uncertainty keeps major players on the sidelines.
2.3. The US Dollar Index (DXY) Resurgence
The inverse correlation between the US Dollar and Gold remains the bedrock of the current market structure. As of November 24-25, 2025, the US Dollar Index (DXY) is trading near a six-month peak, hovering around the 100.10 – 100.20 level.3
2.3.1. Drivers of Dollar Dominance
- Comparative Exceptionalism: Despite mixed labor signals (unemployment edging up to 4.4%), the US economy continues to display pockets of resilience that outpace the Eurozone and China.8 This growth differential attracts capital to US assets.
- Yield Differentials: With the Fed potentially holding rates steady while the ECB considers easing to combat stagnation, the spread between US Treasuries and German Bunds widens, favoring the USD.
- Liquidity Preference: In times of opacity—such as the current data vacuum—capital seeks the deepest, most liquid market: the US Dollar.
Strategic Note: The strength of the DXY at 100.20 acts as a “lid” on Gold prices. For XAU/USD to stage a sustainable breakout above $4,100, we would likely need to see a technical breakdown in the DXY below 99.80. Until that occurs, any rally in gold is likely to be sold.14
3. Geopolitical & Structural Demand Analysis
While macroeconomic factors like rates and the dollar provide the ceiling for gold prices, the geopolitical and structural landscape provides the floor. It is the “Fear Premium” and physical demand that prevent the price from collapsing back to pre-2024 levels despite the high rates.
3.1. The “Fear Premium”: War and Instability
The global geopolitical theater remains fraught with risks that support the safe-haven narrative. Snippets indicate “intensifying Russia-Ukraine war and fresh conflicts in the Middle East” continue to be active drivers.11
- Mechanism: In a world of elevated conflict, gold serves as a non-sovereign store of value—an asset that cannot be frozen or sanctioned if held physically. This demand is price-inelastic; sovereign actors and high-net-worth individuals accumulate gold regardless of the interest rate environment to hedge against existential regime risks.
- Tuesday Relevance: Traders are wary of holding short positions over weekends or even overnight during periods of heightened tension. This creates a “dip-buying” behavior where algo-traders automatically bid gold when it approaches key support levels like $4,020, anticipating that geopolitical headlines could trigger a gap up.
3.2. Structural Demand Shifts: Central Banks and Industry
The current rally to $4,000+ is not merely speculative; it is underpinned by a historic shift in physical demand dynamics.
3.2.1. Central Bank Accumulation
Central banks, particularly those in the Global South (China and India), are driving approximately 67% of global gold demand.15 Since 2022, central bank purchases have been more than double their 2015-2019 averages.16 This is a strategic “de-dollarization” trend. These buyers are less sensitive to daily price fluctuations, providing a “soft floor” under the market. Even as speculative money leaves due to high US rates, official sector buying absorbs the supply.
3.2.2. The Solar Substitution Effect
Interestingly, the high price of gold/silver is beginning to destroy demand in industrial sectors. The solar industry, a major consumer of silver (which correlates highly with gold), is actively “working hard to find viable substitutes” for precious metals due to “stubbornly high prices”.5
- Insight: While this is bearish for silver in the long run, it signals that the current price levels are straining industrial users. For gold, this is less relevant as its demand is primarily monetary/jewelry, but it highlights that the commodities complex is reaching a price point where “demand destruction” becomes a real economic force.
3.2.3. The Indian Wedding Season Paradox
There is a notable divergence in regional pricing. While US gold prices (XAU/USD) remain near highs, domestic prices in India have seen declines.17 However, import data shows a surge—silver imports in India doubled in October.5
- Analysis: This suggests that price sensitivity in the world’s second-largest consumer (India) is kicking in. Consumers are waiting for dips. The fact that Indian prices are softening while global prices hold firm suggests a potential temporary lull in physical demand from the subcontinent, which could remove a key support pillar in the short term, validating the bearish intraday bias for Tuesday.
4. Technical Analysis: The Chart Landscape
The technical structure of XAU/USD on the daily and 4-hour timeframes reveals a market in consolidation, coiling for a breakout but currently respecting well-defined boundaries.
4.1. Price Structure and Trend Hierarchy
- Primary Trend (Secular): Bullish. The trade above $4,000 confirms the secular uptrend that began with the breakout from $2,000. The long-term moving averages are sloping up, although price is currently testing their validity.
- Secondary Trend (Cyclical): Corrective/Neutral. Since reaching all-time highs near $4,360, the market has entered a distribution phase. The price action since mid-November 2025 has been characterized by lower highs and a failure to sustain momentum above $4,130.2
- Immediate Trend (Tactical): Range-Bound. Gold is effectively trapped in a “box” between $4,020 and $4,130.
4.2. Advanced Indicator Analysis
- Relative Strength Index (RSI): The 14-day RSI is currently reading 61.19 on some feeds 4 and near 50-52 on others.2 This discrepancy likely depends on the exact timeframe (H4 vs Daily). Averaging these, the RSI is in neutral territory. It is not overbought (>70) nor oversold (<30).
- implication: Neutral RSI in a consolidation pattern is a “coiled spring.” It indicates that the market has digested the previous move and is building energy for the next leg. A breakout in either direction will not be immediately hindered by overextended momentum conditions.
- Stochastic Oscillator: The Stoch (9,6) is reading 77.78, nearing the overbought zone.4 This supports the “Sell Rallies” bias, as upward momentum is closer to exhaustion than downward momentum.
- Moving Averages (The Battleground):
- SMA 200: Depending on the data feed, the 200-day MA is cited around $4,074 – $4,100.4 The price is currently oscillating around this long-term mean. A daily close decidedly below the 200 SMA would be a catastrophic technical signal, shifting the regime from “Bull Market Correction” to “Bear Market Entry.”
- SMA 50: Providing short-term support near $4,000 – $4,066. The convergence of the SMA 50 and SMA 200 suggests a massive decision point is imminent.
4.3. Chart Patterns: The “Triangle” vs. “Rectangle”
- The Failed Triangle: There is mention of a triangle breakout that targeted $4,250 but failed to sustain.18 Failed patterns are powerful signals. The failure of a bullish breakout often leads to a fast move in the opposite direction (the “Bull Trap”).
- The Consolidation Box: The most reliable pattern currently is the rectangle bounded by $4,020 (Support) and $4,130 (Resistance).
- Strategy: In a box pattern, the most profitable strategy is “Mean Reversion.” Fade the edges. Do not anticipate the breakout until it is confirmed by a daily close.
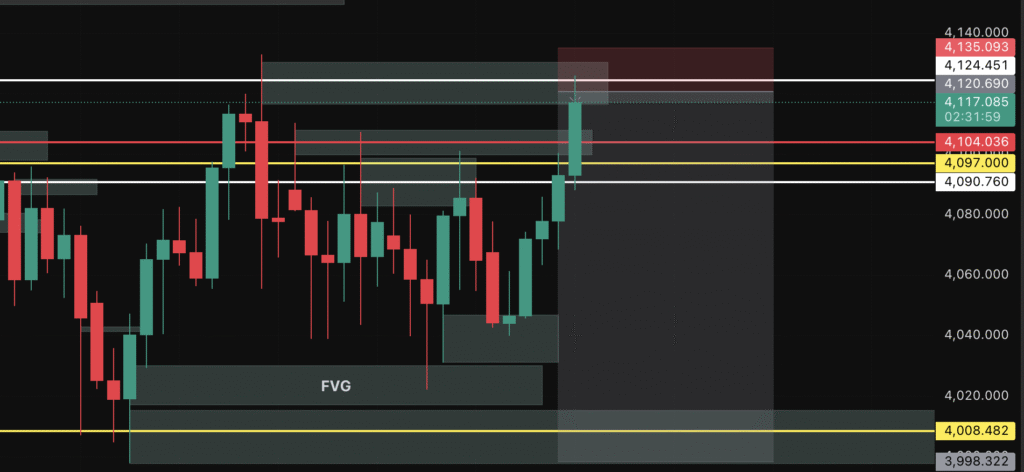
4.4. Key Support & Resistance Levels (November 25, 2025)
| Level Type | Price Zone (USD/oz) | Significance | Action |
| Major Resistance | $4,130 – $4,132 | The “Line in the Sand.” Failed to break last week.2 | Hard Stop Loss location for Shorts. |
| Intraday Supply | $4,090 – $4,100 | Confluence of 200 SMA and psychological round number. | Primary Sell Zone for Tuesday. |
| Pivot Point | $4,065 | Last week’s closing stability point.2 | Decision Line. Above = Bullish, Below = Bearish. |
| Intraday Support | $4,050 – $4,052 | Asian session low and near-term bullish invalidation.19 | Scalp Buy location. |
| Major Support | $4,020 – $4,022 | Bottom of the consolidation box.2 | Take Profit target for Shorts. |
| Critical Support | $3,960 – $3,980 | Deep value zone. Break below triggers crash to $3,800.3 | Strategic Buy Limit location. |
5. Economic Calendar & Event Risk: The Week Ahead
Trading in the week of November 24–28, 2025, is complicated by the US Thanksgiving holiday (Thursday, Nov 27). This typically results in lower liquidity and higher potential for erratic volatility—”whipsaws”—as institutional desks thin out.
5.1. The Tuesday “Data Dump” (Nov 25)
Tuesday is the primary trading day of the week. With Thursday closed and Wednesday packed, Tuesday is when positions are adjusted.
- 09:00 ET – S&P/Case-Shiller Home Price Index: A leading indicator of asset inflation and the “wealth effect.” Higher home prices generally support consumer confidence (Bearish Gold).
- 10:00 ET – Richmond Fed Manufacturing Index: A key regional gauge. A negative print (below zero) would signal industrial contraction, potentially reigniting “recession” fears and boosting gold.
- 10:00 ET – Consumer Confidence (Crucial): This is the marquee event.
- Context: With Black Friday looming on Nov 28, the market is obsessed with the health of the US consumer.1 The NRF predicts record holiday sales of $1 Trillion+. If Consumer Confidence comes in strong (validating the NRF forecast), it reinforces the “Soft Landing” narrative. This is Bearish for Gold as it keeps the Fed on hold (no need to cut rates to save the economy).
- Scenario: A strong print (>105.0) -> DXY spikes -> Gold falls to $4,035.
- Scenario: A weak print (<98.0) -> Recession fear -> Gold rallies to $4,110.
5.2. Wednesday Risks (Nov 26)
- PCE Price Index & Q3 GDP: These are massive data points released the day before a holiday.
- Risk: Traders will likely square positions (close trades) on Tuesday afternoon to avoid holding risk through the Wednesday volatility and Thursday holiday. This often leads to a “counter-trend” move at the end of Tuesday’s session (e.g., if Gold fell all day, expect a short-covering rally at 3:00 PM ET).
6. Comprehensive Trading Strategy & Signals
Based on the synthesis of the fundamental “Fed Confusion,” the technical “Neutral/Bearish” indicators, and the “Holiday Liquidity” profile, the following strategies are generated for Tuesday, November 25, 2025.
6.1. Strategy A: The “Fade the Rally” (Primary Intraday)
- Rationale: The DXY is at 6-month highs. Fed cut bets are dropping. The technicals show a failure at $4,130. The path of least resistance is lower, toward the bottom of the range.
- Target Persona: Day Trader / Swing Trader.
- Signal: SELL (Short)
- Entry Zone: $4,090 – $4,098 (Selling into the resistance of the 200 SMA/Round Number).
- Confirmation: Look for a 15-minute “Shooting Star” or “Engulfing Bearish” candle in this zone.
- Stop Loss: $4,135 (Must be above the $4,130 “Line in the Sand”).
- Take Profit 1: $4,065 (Pivot).
- Take Profit 2: $4,025 (Near major support).
- Risk/Reward: Approx 1:2.5.
6.2. Strategy B: The “Asian Drift” Scalp (High Frequency)
- Rationale: Asian sessions have been drifting higher, buying dips near $4,050. Before the NY Open data, the market may stay range-bound.
- Target Persona: Scalper.
- Signal: BUY (Long)
- Entry Zone: $4,052 – $4,055
- Stop Loss: $4,045 (Tight stop below the session low).
- Take Profit: $4,070 – $4,075
- Timeframe: M15 Chart. Close position before 10:00 AM ET data.
6.3. Strategy C: The “Deep Value” Swing (Strategic)
- Rationale: The long-term bull market is intact. Geopolitics provides a floor. If the “Consumer Confidence” data is strong and Gold crashes on Tuesday, it presents a buying opportunity at the structural support level.
- Target Persona: Swing / Position Trader.
- Signal: BUY LIMIT
- Entry Price: $3,980 (The “Doomsday” support level).
- Stop Loss: $3,920 (Invalidation of the medium-term uptrend).
- Take Profit: $4,150 (Return to mean).
- Note: This is a “set and forget” order designed to catch a liquidity spike/crash.
7. Operational Guidelines for Tuesday Session
7.1. The “Holiday Thinness” Protocol
As we approach Thanksgiving, liquidity providers (banks) reduce their order book depth. This means:
- Spreads will widen: The difference between Bid/Ask will increase, especially during news.
- Slippage is likely: Market orders may be filled at worse prices.
- Stop Hunts: Algo-traders will push price specifically to trigger stops clustered above $4,100 and below $4,050.
- Guideline: Reduce position size by 50%. If you normally trade 1 Lot, trade 0.5 Lots. Use Limit Orders instead of Market Orders to control entry price.
7.2. Scenario Planning Table
| Event | Outcome | Gold Reaction | DXY Reaction | Trade Action |
| Consumer Conf. | Strong (>105) | Bearish Break | Bullish | Sell breakdown of $4,050. Target $4,022. |
| Consumer Conf. | Weak (<98) | Bullish Spike | Bearish | Buy breakout of $4,075. Target $4,100. |
| Consumer Conf. | As Expected | Chop/Range | Neutral | Fade range edges ($4,055 – $4,090). |
| Geopolitics | New Headline | Safe Haven Fly | Neutral | Buy immediately. Ignor technicals. |
8. Conclusion
The analysis for Tuesday, November 25, 2025, points to a market that is structurally bullish but tactically bearish. The macro headwinds of a “Higher-for-Longer” Fed and a strong Dollar are currently overpowering the geopolitical safe-haven bid in the short term.
The “Signal” is to respect the $4,130 ceiling. Until that level is broken on a daily closing basis, the probabilities favor the sellers. However, the astute trader recognizes that the $4,000 level represents a historic accumulation zone. We are trading a range, not a trend. Discipline, reduced sizing, and awareness of the “Thanksgiving Liquidity Drain” are the keys to surviving and profiting in this session.
Final Directive: Sell the rip. Buy the crash. Respect the Range.
Leave a Reply