I. Executive Summary: Strategic Outlook and Actionable Signal Matrix
1.1. Core Thesis: Extreme Bullish Fundamentals Override Immediate Technical Overextension
As of October 7, 2025, Gold (XAU/USD) is trading at an unprecedented all-time high, consolidating immediately below the critical $4,000 psychological level, having recently touched $3,985.48 per troy ounce.1 The analysis confirms that the prevailing structural tailwinds—rooted deeply in accommodative monetary policy expectations and heightened global political uncertainty—are maintaining overwhelming momentum, effectively overriding the short-term tactical risk associated with technically overextended or consolidating price action.
The extraordinary year-to-date gain of over 50% 3 is conclusive evidence that the current ascent is not merely a cyclical or speculative spike, but rather a profound structural rotation. This rotation is driven by fundamental shifts in capital allocation, specifically large-scale central bank diversification and mass private sector flight toward safe-haven assets in response to systemic political risks, such as the ongoing US government shutdown.2 This established momentum dictates a strategic approach: technical price dips are highly probable to represent aggressive buying opportunities, rather than preceding a major trend reversal. Although short-term moving averages exhibit a slight negative bias due to immediate profit-taking near the peak, the longer-term indicators maintain an aggressive “Strong Buy” posture 6, justifying a sustained bullish bias.
1.2. Summary of Strategic Recommendation
The core strategic recommendation is to initiate or maintain a Long (Buy) position. This strategy is predicated on trading the anticipated breakout above the $4,000 psychological barrier, utilizing the current high-base consolidation structure observed on the 1-hour (H1) chart as the optimal high-probability entry zone.
Primary XAU/USD Trading Signal Matrix (October 7, 2025, H1 Focus)
| Direction | Rationale (F/T Synthesis) | Entry Zone (Initial) | Stop Loss (S/L) | Take Profit (TP1) | TP2 (Breakout) |
| Buy (Long) | Structural Fed easing, high inflation risk, and critical safe-haven flows outweigh short-term profit-taking at the ATH. | $3,940 – $3,955 | $3,920 | $3,995 | $4,050 |
1.3. Risk Disclosure and Contingency Strategy
Near-term price risk remains heightened due to the sheer velocity of the recent rally and the proximity to the critical $4,000 psychological resistance, which may trigger an aggressive wave of profit-taking by short-term traders. Furthermore, a rapid, unexpected resolution of the ongoing US government shutdown could temporarily deflate the immediate safe-haven premium, causing a swift, sharp correction.
The contingency protocol requires rigorous risk management: if XAU/USD closes an hourly candle decisively below the $3,920 support level, the immediate bullish high-base structure is invalidated. A breach of this level signals a probable deeper correction toward the MA100 exponential level at $3,906.22.6 Should this occur, all long positions must be systematically liquidated, and re-entry should only be considered following confirmation of robust demand in the $3,900-$3,906 structural support region.
II. Macroeconomic Foundation: The Perfect Storm for Gold (Fundamental Analysis)
The current rally in Gold is underpinned by a robust combination of monetary policy shifts, persistent negative real yield expectations, and acute geopolitical anxieties, creating an exceptionally favorable environment for the precious metal.
2.1. Structural Devaluation: The Federal Reserve’s Rate-Cutting Cycle
The Federal Reserve has definitively pivoted toward an accommodative monetary stance. The process began with the first reduction in borrowing costs since December, a 25 basis-point rate cut delivered in September 2025.7 This move signals the formal initiation of a decisive easing cycle, which systematically diminishes the opportunity cost of holding non-yielding assets like gold.2
Market conviction surrounding the continuation of this easing cycle is extremely high for the fourth quarter of 2025. Technical probabilities, derived from market pricing models, indicate overwhelming expectations for additional 25 basis-point rate cuts in both the upcoming October and December FOMC meetings, with reported probabilities reaching 93% and 82%, respectively.3 These scheduled policy decisions function as predictable, high-impact catalysts that will continue to fuel structural price appreciation in gold. Reflecting this forward guidance, the median projection from the Federal Open Market Committee (FOMC) participants places the federal funds rate range at 3.50%-3.75% by the end of 2025.8 This anticipated 50-75 basis point reduction from the current 4.00%-4.25% range provides a clear fundamental validation for the sustained gold bull run.
2.2. The Real Yield Environment: Inflationary Pressure as the Multiplier
Gold’s intrinsic valuation is fundamentally tied to the trajectory of real interest rates, calculated as the nominal interest rate less the prevailing inflation rate. The structural support for gold stems from the fact that while the Federal Reserve is aggressively cutting the nominal rate, US inflation is projected to remain stubbornly sticky and potentially increase into the second half of 2025.9
This confluence of falling nominal rates and elevated or rising inflation is highly conducive to a further decline in real yields, potentially pushing them deeper into negative territory. When real yields fall or are negative, holding gold becomes exponentially more attractive as a reliable hedge against wealth erosion and currency debasement. Specific components are driving the forecast inflationary squeeze in the latter half of 2025. These include the mechanical calculation of Owners’ Equivalent Rent (OER), which accounts for approximately one-third of the core Consumer Price Index (CPI) basket, acting as a primary driver for year-end inflation.9 Furthermore, sticky labor costs continue to provide a floor under services inflation, and anticipated tariff impacts starting in late Q3/Q4 2025 are expected to eliminate core goods deflation, particularly affecting import-exposed products.9 This combination strongly suggests that inflation is entrenched, reinforcing structural demand for hard monetary assets.
2.3. Geopolitical and Systemic Risk Flows (The Tactical Catalyst)
In addition to the structural monetary backdrop, immediate tactical risk has provided an acute short-term catalyst for the move toward $4,000. The ongoing US government shutdown, now persisting for a seventh day, is significantly intensifying market uncertainty and driving aggressive safe-haven flows directly into gold.2 This environment of political paralysis adds a substantial, transient risk premium to the precious metal’s price.
Underpinning the rally is an unprecedented level of accumulation by institutional players and central banks. The rally is fundamentally sustained by record central bank purchases, which reflect a strategic, structural trend toward diversification and, potentially, de-dollarization.3 The People’s Bank of China, for instance, has added gold to its reserves for the eleventh consecutive month.3 Concurrently, large-scale private sector capital has poured into gold-backed instruments, reflected by heavy institutional inflows into exchange-traded funds (ETFs) such as the SPDR Gold Shares (GLD), which jumped substantially in value.2 This combination of sovereign diversification and institutional hedging solidifies gold’s role as the world’s preferred hedge against global turbulence and market anxiety.2
2.4. Long-Term Price Forecast Contextualization
The combined strength of these fundamental drivers has prompted major financial institutions to significantly upgrade their long-term forecasts. Institutions, including Goldman Sachs, now project XAU/USD to potentially reach $4,900 per ounce by December 2026.3 This long-term projection frames the current challenge to $4,000 not as the market peak, but as a critical intermediate milestone within a multi-year bull market cycle. The velocity of the 50% year-to-date rally has forced market consensus to adjust rapidly; the $4,000 level, previously viewed as a medium-term target 11, is now an imminent tactical hurdle. The $4,900 forecast indicates that even a significant tactical correction from current levels would likely constitute a healthy re-accumulation phase, rather than a reversal of the fundamental trend.
III. Technical Structure and Quantitative Assessment
The technical analysis of XAU/USD as of October 7, 2025, reveals a highly kinetic market characterized by overwhelming long-term strength, juxtaposed with necessary short-term consolidation beneath the all-time high.
3.1. Multi-Timeframe Trend Confirmation
The prevailing trend on the Daily (D1) and Weekly (W1) charts unequivocally confirms an overwhelming “Strong Buy” bias.6 The price action since the beginning of October has been characterized by consistent upward progress, reflecting controlled, sustained institutional capital flow. The speed of the rally is notable; having broken above $3,000 only seven months ago, the price has surged dramatically toward $4,000.4 This extreme velocity is indicative of deep market conviction.
Key long-term dynamic supports remain far beneath the current trading range, providing a substantial structural cushion against unexpected volatility. Notably, the MA100 Exponential (a critical metric for mid-term trend health) is positioned at $3,906.22, while the MA200 Exponential, serving as the broader D1 structural floor, is located at $3,858.64.6
3.2. Hourly Chart (H1) Price Action and Consolidation Dynamics
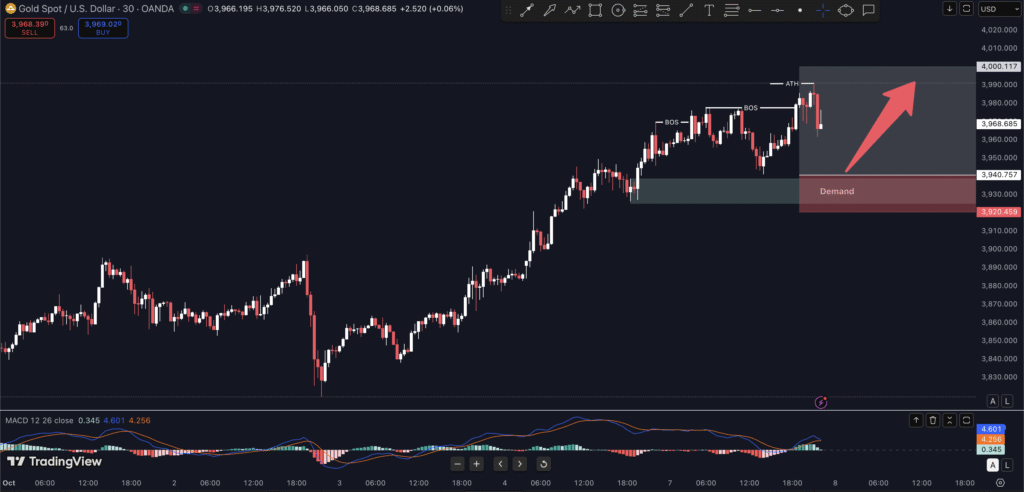
The 1-hour chart provides the most relevant short-term tactical information. Price action is currently exhibiting a tight, high-base consolidation pattern just below the recent intraday highs (around the $3,962 mark) [Image]. In strong momentum environments, this structure is typically interpreted as a continuation pattern, such as a bull flag or pennant, signifying that institutional demand is efficiently absorbing short-term profit-taking pressure without allowing a significant price retreat.
Analysis of the technical indicators further elucidates this pause:
- MACD: The Moving Average Convergence Divergence (MACD, 12, 26, 9) shows a close reading of -0.743 [Image]. This low value suggests an immediate deceleration in price movement or a contraction in short-term volatility. This is a common pattern immediately preceding a major price decision point, such as the attack on the $4,000 psychological barrier, and does not indicate an outright trend reversal.
- Moving Average Conflict: There is a notable conflict among the Moving Averages.6 The shortest-term averages (MA5, MA10, and MA20, both Simple and Exponential) are currently signaling Sell. In contrast, the medium- and long-term MAs (MA50, MA100, and MA200) all maintain an unambiguous Buy signal.6 This divergence is a technical signature of consolidation near an all-time high: the very immediate price (last few hours) is slightly lower than the average price over those short periods (triggering the “Sell” short-term signal), but the underlying trend momentum captured by the MA50 and MA100 remains dominant. This synthesis leads to the overall H1 technical summary conclusion of “Buy”.6
3.3. Quantitative Snapshot: Technical Indicators and Moving Averages
The following data provides the specific quantitative levels derived from the XAU/USD technical analysis as of October 7, 2025, defining the precise dynamic supports used for trade calibration:
XAU/USD Key Technical Levels (H1 Focus, Oct 7, 2025)
| Indicator Type | Name | Value ($) | Signal | Source Data |
| Moving Average (Short-term) | MA5 (Simple) | 3974.69 | Sell | 6 |
| Moving Average (Mid-term) | MA20 (Exponential) | 3962.85 | Sell | 6 |
| Moving Average (Crucial Dynamic Support) | MA50 (Exponential) | 3940.36 | Buy | 6 |
| Moving Average (Structural Support) | MA100 (Exponential) | 3906.22 | Buy | 6 |
| Oscillator Summary | Technical Indicators | N/A | Strong Buy (7/1 ratio) | 6 |
| Overall Bias | Hourly Timeframe | N/A | Buy | 6 |
3.4. Identification of Key Supply and Demand Zones
Given the current trading environment near the historical peak, the established Zone of Resistance is defined entirely by the recent all-time high price action and the psychological level of $4,000.12 Supply zones represent specific price areas where aggressive selling pressure previously overwhelmed demand, leading to sharp price drops.13
Critical Support and Resistance Levels for XAU/USD (H1/D1)
| Level Type | Price ($) | Significance/Rationale |
| Major Resistance (R2) | $4,000 | Definitive psychological barrier; likely magnet for institutional limit orders. |
| Near-Term Supply Zone (R1) | $3,977 – $3,985 | Recent all-time high established on Oct 7; immediate high-probability profit-taking area. |
| Immediate Demand Zone (S1) | $3,940 – $3,955 | Active high-base consolidation support; aligns precisely with the MA50 Exponential (1H). |
| Critical Stop-Loss Support (S2) | $3,920 | Lower boundary of short-term consolidation; failure invalidates bullish continuation structure. |
| Structural Demand (S3) | $3,900 – $3,906 | Strong psychological and technical support, coinciding with the MA100 1H. |
The current price action is actively trading within the immediate supply zone that created the all-time high. The failure of sellers to achieve a significant reversal—as seen by the high-base consolidation pattern—suggests that the supply entering the market is being efficiently absorbed by persistent, underlying institutional demand. The market is demonstrating key characteristics of consolidation before expected further growth and a breakthrough of $3,900+.14
IV. Integrated Signal Derivation and Scenario Planning
4.1. The Bullish Continuation Scenario (Primary Trade)
The primary trade hypothesis centers on an imminent bullish continuation, leveraging the structural tailwinds detailed in Section II.
The key trigger for the next leg up will be the confirmation of sustained price action above $3,955, signaling the end of the consolidation and a renewed aggressive test of the $3,985 peak. This move is most likely to be catalyzed by specific fundamental news, such as escalating uncertainty regarding the US government shutdown or official rhetoric further cementing the probability of the upcoming Fed rate cut.
Execution: Traders should initiate long positions within the defined Immediate Demand Zone (S1) of $3,940-$3,955. The initial profit target (TP1) should be set at $3,995, capturing the move to the $4,000 psychological threshold while accounting for potential volatility immediately preceding the breakout.
Breakout Management (TP2 Strategy): A definitive, high-volume move above $4,000, confirmed by an hourly candle closing above that level, signals a new phase shift in institutional sentiment. The immediate tactical target following this breakout is $4,050, followed by the ambitious weekly high projected at $4,114.01.15 This type of decisive move through a major resistance level is often associated with fundamental paradigm shifts and new breakout opportunities.12
4.2. The Corrective Scenario (Contingency Trade)
The alternative scenario involves a technical breakdown that triggers a deeper price correction. The trigger for this event is the failure to maintain the Critical Stop-Loss Support (S2) at $3,920. Such an event would most likely be driven by an unforeseen rapid, positive resolution to the US political crisis or unexpected hawkish communication from a high-profile Fed official.
Execution: If the H1 candle closes below $3,920, the contingency plan dictates initiating a short position (or reversing the existing long) to capitalize on the corrective move.
Targets: Immediate corrective targets include the MA100 at $3,906.22 (S3).6 Deeper selling pressure would target the weekly low projected near $3,893.96.15 It is noted that a significant pool of liquidity resides below the $3,854 area.14 While a breakdown to this level is currently considered low probability given the fundamental strength, failure to hold $3,900 would likely accelerate the price towards capturing this liquidity pool.
4.3. Risk Management Protocol: Tailing the Momentum
The defined trade structure offers a favorable risk/reward profile. Utilizing a mid-point entry of $3,945 and setting the Stop Loss (S/L) at $3,920 yields a risk exposure of $25 per ounce. Targeting the initial Take Profit (TP1) at $3,995 provides a potential reward of $50 per ounce, establishing a robust 1:2 risk/reward ratio. This ratio is appropriate for trading a high-momentum trend continuation pattern.
Once TP1 ($3,995) is reached, the stop-loss on any remaining position must be dynamically trailed, ideally moved up to the initial entry price or a trailing price that locks in partial profit. This approach secures a risk-free trade on the final run toward and above the $4,000 psychological barrier.
V. Strategic Outlook and Institutional Positioning (2026 Projections)
5.1. The Long-Term Case for $4,900
The current tactical positioning must be viewed within the context of the long-term structural uptrend. The institutional projection of XAU/USD reaching $4,900 by December 2026 3 is validated by the expected continuation of key drivers: consistent central bank buying (projected at 80 metric tons in 2025 and 70 tons in 2026) and a projected significant rise in Western ETF holdings as the Federal Reserve’s easing cycle continues through mid-2026.3 This extreme long-term bullish forecast confirms that the $4,000 level is merely a stepping stone. Therefore, traders should ensure that tactical position management, even during pullbacks, always retains a perspective focused on re-establishing a core strategic long component.
5.2. Portfolio Allocation Strategy
In the prevailing global financial environment—defined by persistent inflation risk, low prospective yields on interest-bearing assets, and sustained geopolitical uncertainty—gold remains a critical component of institutional risk management. Gold fulfills its classic role as a vital hedge and “long-term wealth protector”.2 Institutional portfolios should maintain an overweight allocation to the precious metal and correlated instruments, such as gold-backed ETFs (which continue to see heavy institutional inflows).2 The current technical consolidation just beneath $4,000 should be utilized as a strategic accumulation point for core, long-term holdings, positioning the portfolio ahead of the expected definitive structural breakout above the major psychological threshold.
Works cited
- Gold – Price – Chart – Historical Data – News – Trading Economics, accessed on October 7, 2025, https://tradingeconomics.com/commodity/gold
- Gold on fire again, moves closer to $4000 – here’s what’s fuelling the rise, accessed on October 7, 2025, https://m.economictimes.com/news/international/us/gold-price-prediction-gold-on-fire-again-moves-closer-to-4000-heres-whats-fuelling-the-rise/articleshow/124362626.cms
- Gold price outlook: Goldman Sachs sees yellow metal at $4,900/oz by December 2026. Should you buy? | Stock Market News – Mint, accessed on October 7, 2025, https://www.livemint.com/market/commodities/gold-price-outlook-goldman-sachs-sees-the-yellow-metal-at-4-900-oz-by-december-2026-should-you-buy-11759821719064.html
- Gold (XAU/USD) set to challenge $4,000 as prices renew all-time …, accessed on October 7, 2025, https://www.marketpulse.com/markets/gold-xauusd-set-to-challenge-4000-as-prices-renew-all-time-highs-in-todays-session-potential-targets-and-price-forecast/
- Gold’s Unstoppable Ascent: A $4000 Horizon in Sight Amidst Global Turmoil, accessed on October 7, 2025, https://markets.financialcontent.com/stocks/article/marketminute-2025-10-6-golds-unstoppable-ascent-a-4000-horizon-in-sight-amidst-global-turmoil
- XAU USD Technical Analysis – Investing.com, accessed on October 7, 2025, https://www.investing.com/currencies/xau-usd-technical
- United States Fed Funds Interest Rate – Trading Economics, accessed on October 7, 2025, https://tradingeconomics.com/united-states/interest-rate
- Fed Cuts Rates and Signals More to Come in 2025 – Morningstar, accessed on October 7, 2025, https://www.morningstar.com/economy/fed-cuts-rates-signals-more-come-2025
- US inflation outlook: A squeeze higher in second half of 2025 – RBC, accessed on October 7, 2025, https://www.rbc.com/en/thought-leadership/economics/featured-insights/us-inflation-outlook-a-squeeze-higher-in-second-half-of-2025/
- World Economic Outlook Update, July 2025: Global Economy: Tenuous Resilience amid Persistent Uncertainty – International Monetary Fund (IMF), accessed on October 7, 2025, https://www.imf.org/en/Publications/WEO/Issues/2025/07/29/world-economic-outlook-update-july-2025
- Gold price prediction today: Will stellar gold rally run continue in the near term? Here’s the outlook, accessed on October 7, 2025, https://timesofindia.indiatimes.com/business/india-business/gold-price-prediction-today-india-where-is-gold-silver-rate-headed-on-october-01-2025-mcx-gold-futures-outlook/articleshow/124238129.cms
- Zone of Resistance: What it Means, How it Works – Investopedia, accessed on October 7, 2025, https://www.investopedia.com/terms/z/zone-of-resistance.asp
- Supply and Demand Zones: A Simple Guide – LuxAlgo, accessed on October 7, 2025, https://www.luxalgo.com/blog/supply-and-demand-zones-a-simple-guide/
- XAUUSD Chart — Gold Spot US Dollar Price – TradingView, accessed on October 7, 2025, https://www.tradingview.com/symbols/XAUUSD/
- Gold (XAU/USD) Price Forecast and Analysis for Today, Tomorrow, Next Week, and 30 Days, accessed on October 7, 2025, https://www.litefinance.org/blog/analysts-opinions/gold-price-prediction-forecast/daily-and-weekly/
Leave a Reply