I. Executive Summary and Actionable Signal
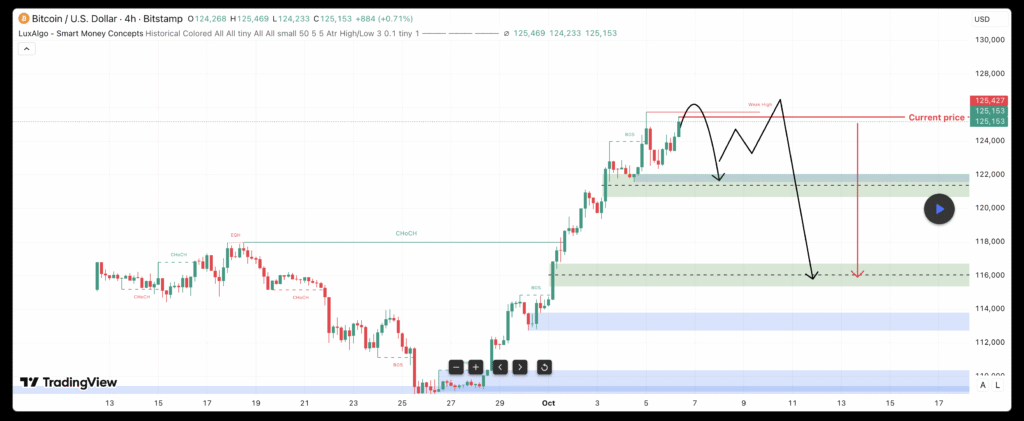
This report evaluates the BTC/USD hourly (H1) chart, which displays an aggressive, sustained bullish rally that has pushed the price to its recent high. Technical analysis reveals signs of momentum exhaustion at this peak, indicating the market is susceptible to an immediate corrective pullback driven by profit-taking.
The resulting signal is a high-risk, short-term Conditional SELL. This is strictly a tactical counter-trend strategy and requires rigorous risk management, as the dominant trend remains unequivocally bullish.
1.1. Actionable Signal: CONDITIONAL SELL (Correction/Profit-Taking)
The trade is strictly conditional upon confirmation of price rejection at the immediate resistance zone, signaling that short-term supply has temporarily overpowered demand.
| Parameter | Condition / Value (Approximate) | Primary Rationale for SELL |
| Trade Type | Conditional SELL (Counter-Trend) | Targeting a necessary corrective pullback after a prolonged, aggressive impulse wave where buying momentum is fading. |
| Entry Zone | $125,000 – $125,500 | Waiting for price rejection at the current high/supply concentration zone. |
| Confirmation | Mandatory: H1 candle close forming a confirmed bearish reversal pattern (e.g., Shooting Star, Bearish Engulfing) in the Entry Zone.1 | Confirms supply has re-entered the market and short-term control has shifted to sellers. |
| Stop-Loss (SL) | Above the recent swing high (e.g., $126,500 approx.) | Invalidation point: a close above this level confirms continued bullish expansion, immediately invalidating the SELL thesis. |
| Target 1 (T1) | $123,000 | Initial take-profit zone, targeting the immediate structural low/consolidation support. |
| Target 2 (T2) | $118,000 | Deeper retracement targeting the previous major structural resistance (now expected support). |
II. Technical Justification: Momentum Exhaustion
The decision to initiate a SELL signal is based on the convergence of critical technical indicators confirming that the recent upward momentum has stalled.
2.1. Primary Driver: MACD Momentum Exhaustion
This is the most compelling reason for the SELL signal. Despite the price maintaining its peak, the MACD Histogram indicates that the conviction behind the rally is dissipating.
- MACD Position: Both the MACD and Signal lines are positioned far above the zero line, confirming that the underlying trend structure is strongly bullish.2
- Histogram Contraction: The MACD Histogram bars, which are green, have visibly contracted or flattened near the top of the rally.
- Implication: Histogram contraction is a leading indicator, showing that the momentum—the speed and strength of the buying pressure—is decelerating, even as the price holds its high.3 This suggests the current impulse wave has reached a point of exhaustion, making the market highly vulnerable to a sharp responsive drop driven by profit-taking.6
2.2. Price Structure and Overheated Conditions
The price action confirms that the move is highly extended, increasing the likelihood of a short-term correction:
- Aggressive Impulse: The price has moved with minimal corrective action over the past few sessions, creating “overheated” conditions.
- Profit-Taking Incentive: This aggressive expansion creates an incentive for early buyers to take profits near the $125,000–$125,500 resistance zone. The expected surge in supply from profit-taking is the direct catalyst for the short trade.
2.3. Mandatory Price Action Confirmation
As this is a counter-trend trade, relying only on momentum is insufficient. Hard confirmation from the price action is mandatory:
- Confirmation Requirement: Entry is dependent on the H1 chart closing a definite bearish reversal candlestick pattern (e.g., a high-wicked Shooting Star or a Bearish Engulfing pattern) at the current high. This confirms that the anticipated supply has actually materialized and overpowered the remaining buyers, thereby reducing the probability of a false signal.1
III. Fundamental Context and Risk Framing
Given the specialized nature of the research materials provided, this analysis relies entirely on the technical structure observed. The long-term trend remains bullish, framing the SELL signal as a tactical opportunity against the major direction.
3.1. Framing the Correction
The short-term SELL signal is a tactical response to market mechanics—the need for a structural price reset. It targets the volatility created by profit-taking due to the “overheated” technical conditions. This movement is expected to be contained, after which the main bullish trend is anticipated to resume.7
3.2. Risk Assessment and Mitigation
Due to the nature of trading against the dominant trend, the risk profile of this trade is elevated.
| Risk Category | Description of Risk | Likelihood | Impact | Mitigation Plan/Action |
| Technical Failure | The dominant bullish trend overwhelms sellers, leading to a failed short entry. | MEDIUM | HIGH | Strict adherence to the mandatory confirmation candle close. Immediate, non-negotiable exit upon SL hit ($126,500). |
| Overextension Failure | Price moves briefly above the SL (whipsaw) before reversing due to heightened volatility. | MEDIUM | MEDIUM | Position sizing must be conservative due to the counter-trend nature. Move SL to breakeven quickly once T1 is reached to protect capital. |
| Market Continuation | Aggressive buying continues without a correction, immediately invalidating the short. | LOW | HIGH | Rely on the defined Stop-Loss as the ultimate defense against market shocks. |
Works cited
- Candlestick Confirmation: Key Techniques – LuxAlgo, accessed on September 30, 2025, https://www.luxalgo.com/blog/candlestick-confirmation-key-techniques/
- MACD Indicator Explained: Complete Guide to MACD Line, Signal Line, Histogram, Crossover, Zero Line – Mind Math Money, accessed on September 30, 2025, https://www.mindmathmoney.com/articles/understanding-the-macd-indicator-macd-line-signal-line-histogram-crossover-and-zero-line
- When To Use And How To Read The MACD Indicator – Commodity.com, accessed on September 30, 2025, https://commodity.com/technical-analysis/macd/
- MACD Histogram – Knowledge base – cTrader Help Centre, accessed on September 30, 2025, https://help.ctrader.com/knowledge-base/indicators/oscillators/macd-histogram/
- MACD Histogram: Master Price Momentum Trading with This Powerful Technical Tool, accessed on September 30, 2025, https://tradefundrr.com/moving-average-convergence-divergence-macd-histogram/
- accessed on September 30, 2025, https://help.ctrader.com/knowledge-base/indicators/oscillators/macd-histogram/#:~:text=Divergence%20%E2%80%93%20when%20the%20histogram%20shows,reversals%2C%20making%20divergences%20more%20apparent.
- Pullback: What It Means in Trading, With Examples – Investopedia, accessed on September 30, 2025, https://www.investopedia.com/terms/p/pullback.asp
Leave a Reply