The XAU/USD market has entered a critical consolidation phase following a period of unprecedented volatility characterized by a sharp correction from the all-time high of $4381.44 to the structural demand zone near $4004.28.1 This market event, spanning several days, represented the sharpest single-day decline witnessed since August 2020.2 The resulting price action dictates that XAU/USD is now at a technical decision point, caught between sustained, structurally bullish fundamental forces and short-term resistance fueled by profit-taking and speculative unwinding.1 This report provides an exhaustive analysis using fundamental, technical, sentiment, and commitment of traders (COT) proxies to derive actionable trade setups for the upcoming trading week.
I. Executive Synthesis: Directional Bias and Key Decision Levels
A. Summary Forecast and Primary Bias
The primary directional bias for the upcoming week is assessed as Neutral-to-Cautiously Bullish. This outlook is contingent upon the market’s continued successful defense of the critical $4100 pivot zone. The current expectation is for continued accumulation within the defined consolidation range of $4060 to $4163 before a potential volatility expansion occurs.
The Primary Scenario (Bullish Expansion) requires the market to defend the $4059 liquidity sweep low 4 and generate a decisive break above the key consolidation upper pivot at $4162.93.1 A structural long position is validated by a confirmed daily close above the $4192.86 threshold 1, which would target a retest of the recent record high ($4381.44).
The Secondary Risk Scenario (Correction Continuation) would be triggered by a confirmed failure to sustain price above the $4100-$4107 cluster of moving averages [Image]. This would likely lead to a retest and breach of the critical psychological and structural support zone at $4000-$4004.28.1 A violation of this floor would restore strong bearish momentum, shifting focus to the near-term value zone targets around $3846.50 and the 50-day moving average at $3741.61.1
B. Critical Weekly Trading Pivots
Immediate directional clarity for Monday’s opening hinges on two exceptionally critical pivots:
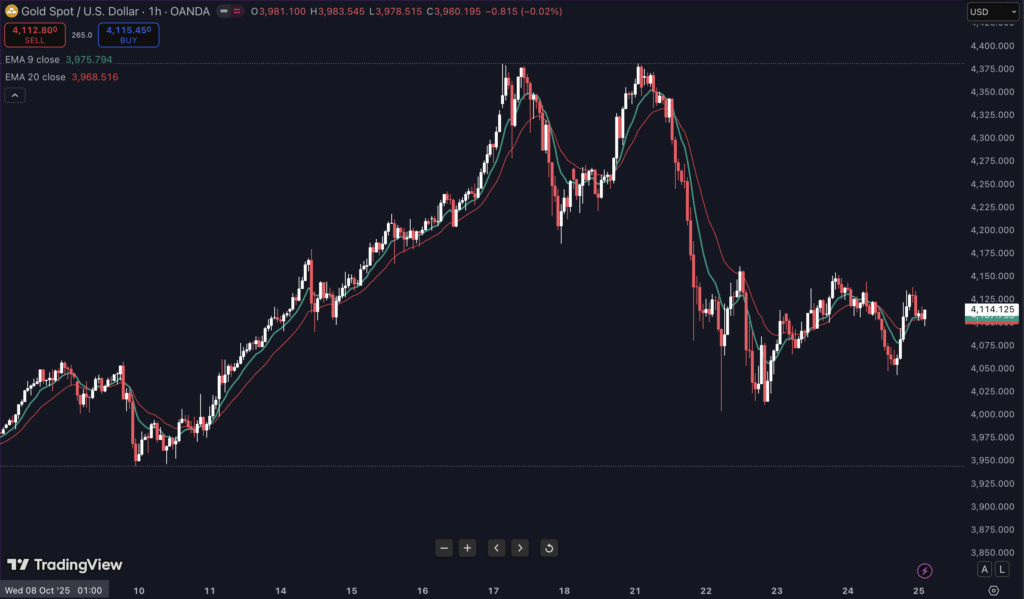
- Defense Pivot ($4100.43 – $4114.01): The closing price for the week ($4,114.125) is currently resting precisely within this narrow stabilization range.1 Examination of the H1 chart reveals the price is clustered tightly around the confluence of the Exponential Moving Averages (EMAs): EMA 9 is positioned at $4,107.755 and EMA 20 at $4,105.010 [Image]. A sustained close below $4100 would signal a bearish intention to target the accumulated stops clustered near the $4060 area.
- Structural Activation Pivot ($4192.86): This level represents the immediate structural ceiling.1 Until institutional buyers can establish a confirmed close above this resistance, the market is technically confined to a corrective and consolidative state, irrespective of the strong underlying fundamental strength. A breakout above this level signals the conclusion of the corrective phase.
II. Foundational Analysis: Macroeconomic and Geopolitical Drivers (Fundamental)
The recent gold rally, which pushed the yellow metal to record highs, was notable because it demolished some traditional economic tenets, specifically performing strongly even as the US dollar strengthened against major peers.5 The current stabilization phase is underpinned by powerful, systemic drivers that define the long-term structural bullish thesis for gold.
A. The Federal Reserve Policy Catalyst: Structural Bullish Reinforcement
The immediate and most potent fundamental catalyst for the upcoming trading period is the anticipated monetary policy action by the Federal Reserve, scheduled for October 29.
The data indicates that the probability of a Fed rate cut on October 29 is exceptionally high, standing at approximately 99%, according to the CME Group’s FedWatch tool.6 This expectation is key because historically, gold prices tend to rise when the Fed cuts interest rates and decline when rates are raised.6 The rationale is rooted in capital flows: lower interest rates significantly reduce the attractiveness of interest-earning assets, prompting institutional and private investors to shift capital into non-yielding alternatives like gold, thereby increasing demand and price.6
Given the near certainty of the rate cut, the recent sharp correction in XAU/USD was less likely a fundamental rejection of the dovish policy outlook and more a tactical speculative unwinding and profit-taking event.3 The rate cut announcement, while potentially priced in for the immediate moment, will formally validate the long-term structural bullish thesis for Gold for the remainder of Q4 2025 and into 2026. This foundational support fundamentally limits the realistic downside risk beneath the $4000 psychological barrier, positioning that area as a high-value accumulation zone.
B. Geopolitical Risk Premium Assessment
While short-term profit-taking was accelerated by market optimism following signs of thawing U.S.-China relations 2, the persistent backdrop of global systemic risk ensures a sustained baseline demand for gold.7 Geopolitical tensions, including ongoing conflicts in Eastern Europe and the Middle East 8, along with the resurfacing of U.S.-China trade conflicts and new sanctions imposed on Russian oil firms 1, continue to influence the price outlook.
These events maintain the safe-haven demand for gold.1 When sustained, these tensions typically cause gold prices to maintain elevated levels, albeit with reduced volatility. Trade disputes and economic sanctions, in particular, lead to gradual but longer-lasting price appreciation as economic impacts unfold slowly.7 The recent rapid price drop, therefore, aligns with the “Resolution/De-escalation Phase” noted in risk models 7, being a tactical market reaction to trade optimism rather than a structural dismissal of risk. The continued presence of active geopolitical stresses ensures that gold remains a necessary hedge against systemic risk and currency devaluation, reinforcing the structural importance of the $4000 zone as a key buying opportunity.
C. Central Bank Demand and Institutional Forecasts
Institutional commitment to gold remains profoundly bullish, providing substantial structural support for prices irrespective of short-term volatility. Central banks have consistently been net buyers of gold.3 Furthermore, major financial institutions such as Goldman Sachs remain “structurally bullish gold,” projecting a target of $4,900 per ounce by the end of 2026.3
Institutional investment behavior confirms this commitment. Exchange-Traded Funds (ETFs) backed by physical gold posted a record inflow of $26 billion in the third quarter of 2025, signaling renewed interest from institutional asset managers.10 Analysts believe that central bank purchases likely picked up again in September and October, following typical seasonal post-summer lulls.3 This confluence of sustained sovereign buying and high-conviction institutional accumulation suggests that large long-term investors are aggressively utilizing the recent correction to add to positions. This institutional buying validates the current $4000-$4130 price range as a preferred accumulation area for smart money, making strong bearish conviction highly unfavorable near these established lows.
III. Liquidity Flows and Market Positioning (COT and Sentiment)
Analysis of market positioning provides crucial insight into short-term liquidity targets and validates the long-term intention of institutional capital.
A. Institutional Commitments (Flow Analysis Proxy)
While the official Commitments of Traders (COT) report may be suspended due to governmental operations 11, reliable proxies confirm extraordinary institutional engagement. The Micro Gold (MGC) futures, a product typically dominated by institutional participants, recorded an average daily volume (ADV) of 312,831 contracts in October 2025, marking the second-highest monthly record in history and representing a 64.5% month-over-month increase.12
This surge in futures volume coincides perfectly with the aforementioned record ETF inflows.10 This pattern strongly suggests that while short-term speculative non-commercial traders may have been forced to exit or unwind positions during the sharp crash, long-term asset managers, sovereign wealth funds, and pensions were actively entering the market. These investors operate on multi-quarter approval cycles and multi-year horizons, implying an upside risk to long-term forecasts and providing a strong floor of demand.3
B. Retail Sentiment as a Contrarian Indicator
Current retail positioning suggests caution regarding the immediate directional move, confirming the potential for a short-term market shakeout to clear out weak positions. As of October 25th, retail traders remain moderately net long on gold, with 58% long positions versus 42% short.13
In technical analysis employing contrarian theory, a heavily skewed retail positioning often indicates the presence of clustered stop losses that serve as necessary liquidity for institutional movements. The stop losses for these retail long positions are highly likely to be grouped just below the $4100 key pivot and aggressively below the $4059 swing low. This positioning confirms a potential short-term contrarian bearish bias 13, meaning the market structure is optimized for a quick, targeted dip or liquidity sweep down toward the $4060 area early in the week before the structurally bullish trend can safely resume. This validates the utility of tactical scalping short setups near the consolidation high.
IV. Technical Structure Breakdown (Price Action and Indicators)
The technical framework for XAU/USD is defined by the ongoing consolidation, which has arrested the severe downtrend initiated from the recent record high.
A. Higher Timeframe Context (Daily/4H)
The higher timeframe chart suggests the market has concluded a severe corrective movement, potentially marking the completion of an Elliott Wave corrective pattern (ABC).13 This action resulted in the establishment of a potential higher low near $4004.28.1 The overarching technical task for bulls is to regain control by overcoming the major structural resistance at $4192.86.1 Until this level is convincingly broken, the technical narrative remains one of consolidation and correction, despite the bullish fundamentals.
B. H1/M30 Intraday Structure and EMA Confluence
The immediate battleground for Monday is evident on the H1 chart. The price ($4,114.125) is currently entangled within the two primary short-term moving averages: the EMA 9 at $4,107.755 and the EMA 20 at $4,105.010 [Image]. This tight clustering of price and exponential moving averages signifies an equilibrium state, where short-term momentum has effectively diminished.
Analysts project stabilization within the narrow range of $4059.90–$4114.01 before higher resistance tests.1 The broader consolidation pivots are defined by $4100.43 (lower) and $4162.93 (upper).1 This congested pattern implies that the market requires a significant influx of volume on Monday to decisively push the price away from the $4105-$4120 zone. A confirmed short-term close (M30 or H1) above $4120 suggests a move to test the consolidation high near $4163. Conversely, a loss of $4100 opens the door for the retail stop hunt toward $4060. Intraday strategies must therefore focus on trading the confirmed breaks or utilizing defensive entries at the periphery of the established $4060 – $4163 range.
C. Key Technical Levels and Zones
The following matrix synthesizes the critical technical zones that will determine the success of directional moves across all trading timeframes.
Technical Level Mapping for XAU/USD (October 2025)
| Level Type | Price Zone | Significance | Timeframe Relevance | Scenario Context |
| All-Time High | $4381.44 | Ultimate Bullish Target.1 | Positional | Structural upside target. |
| Structural Resistance 1 (Breakout) | $4192.86 | Signals renewed bullish momentum towards record highs.1 | Swing/Positional | Key threshold for Long activation. |
| Intraday Supply Zone | $4136 – $4150 | Premium selling zone/Consolidation top (Short Scalping).4 | Scalping/Intraday | Rejection required for short bias. |
| CRITICAL PIVOT ZONE | $4100 – $4115 | Current equilibrium; cluster of EMAs [Image] and key pivots.1 | All Timeframes | Immediate directional determinant for Monday. |
| Intraday Demand Zone | $4059 – $4061 | Liquidity Sweep low 4; high-probability demand zone for Intraday Longs. | Intraday/Scalping | Strong Long setup area. |
| Structural Support 1 | $4000.00 – $4004.28 | Psychological and critical technical support; failure restores bearish sentiment.1 | Swing/Intraday | Final defense line for bulls. |
| Structural Support 2 (Value Zone) | $3846.50 | Lower target if $4000 fails.1 | Swing | Target for confirmed Correction Continuation (50-Day MA is $3741.61). |
V. Actionable Trade Signals: Scenario-Based Strategy
Based on the synthesis of analysis, two primary trade scenarios are defined to capitalize on short-term volatility while maintaining alignment with the long-term structural direction.
A. Bullish Scenario Activation: Accumulation and Breakout Signal (Primary Focus)
The primary strategic objective is to capitalize on the institutional accumulation phase by purchasing weakness derived from the short-term liquidity sweep.
- Intraday Long Signal: This signal involves initiating a long position upon observing a confirmed H1 reversal pattern (e.g., bullish engulfing candle or pin bar) within the $4059 – $4065 demand zone.4 This strategy directly exploits the anticipated liquidity sweep of retail stops and positions the trader for the rebound back toward the consolidation mid-point.
- Swing Long Signal (Positional): The highest conviction trade involves initiating a structural long position from the $4000 – $4010 zone. This provides an excellent risk-to-reward ratio based on the foundational support provided by central banks and the imminent Fed rate cut.3 This long trade is fundamentally invalidated only by a confirmed daily close below $4000.1
- Breakout Confirmation: Aggressive trend continuation positioning should only be activated upon a confirmed H4 close above the structural resistance at $4193. This signals the definitive end of the correction.
B. Bearish Scenario Activation: Tactical and Confirmation Signal (Contingency Focus)
Bearish setups are reserved for tactical, counter-trend scalps within the consolidation box or for high-level structural confirmation if the $4000 floor fails.
- Scalping Short Signal: Execute a tactical short position upon observing a rapid rejection and a confirmed M15 bearish engulfing candle 4 from the high-risk premium zone of $4136 – $4138, targeting the $4100 pivot. This capitalizes on the consolidation ceiling.
- Structural Short Signal: This trade is reserved for market structure failure. Execute a short position only upon a decisive daily close below $4000. This confirms the breakdown, invalidates the structural bullish thesis, and targets the lower value zone of $3846.50.1
VI. Precision Trade Setups (SL/TP Detailed Plans)
The following matrix provides explicit parameters for precise execution, ensuring disciplined risk management tailored to the required trading styles.
XAU/USD Actionable Trade Setup Matrix (For Monday, October 2025)
| Trade Style | Bias | Entry Zone (Price) | Stop Loss (SL) | Take Profit 1 (TP1) | Take Profit 2 (TP2) | R:R Ratio (to TP2) | Context/Reference |
| Scalping (M5-M15) | Short (Tactical Counter-Trend) | $4136.00 – $4138.00 | $4144.00 | $4125.00 | $4110.00 | ~4.0:1 | Rejection of Premium Zone/Supply OB.4 Wait for M15 confirmation. |
| Scalping (M5-M15) | Long (Pivot Defense) | $4097.00 – $4101.00 | $4095.00 | $4107.00 | $4118.00 | ~3.0:1 | Defense of $4100 key pivot and EMA cluster [Image]. |
| Intraday (H1-H4) | Long (Accumulation Re-entry) | $4059.00 – $4065.00 | $4054.00 | $4115.00 | $4160.00 | ~9.0:1 | Retest of Liquidity Sweep low/OB.4 High-probability reversal zone. |
| Intraday (H1-H4) | Short (Breakout Failure) | $4190.00 – $4195.00 | $4200.00 | $4140.00 | $4080.00 | ~4.0:1 | Anticipating rejection at the structural breakout level ($4192.86) before confirmation.1 |
| Swing (Daily/Positional) | Long (Structural) | $4000.00 – $4010.00 | $3980.00 | $4250.00 | $4380.00 | ~18.5:1 | Fundamental long thesis (Fed/Institutions) 3; SL below critical $4000 support.1 |
| Swing (Daily/Positional) | Short (Correction Confirmation) | Confirmed Daily Close below $4000.00 | $4015.00 | $3850.00 | $3741.61 | ~17.0:1 | Bearish sentiment restoration; targeting 50-day moving average.1 |
VII. Risk Management and Execution Guidance
Due to the market’s recent characterization by “rapid speed, large amplitude, and numerous turning points” 4, strict adherence to a disciplined risk framework is mandatory for all trade execution.
A. Volatility and Execution Management
- Requirement for Confirmation: The market’s volatile “sweep and clean-up” behavior necessitates avoiding reliance on blind limit orders.4 Entry confirmation must be observed (e.g., M15 reversal candle for scalping, H1 close for intraday) before execution to mitigate the risk of entering into a continuation of a liquidity hunt.
- News Avoidance: All trading activity must cease or risk must be dramatically reduced during high-impact USD news releases.4 With the critical Federal Reserve meeting approaching, price action surrounding news events is likely to exhibit excessive volatility and high slippage potential.
- Liquidity Sweep Protocol: Recognizing the potential for market makers to target stops clustered below $4100 (due to 58% retail long positioning 13), if the price enters the high-value Intraday Long entry zone ($4059-$4065), traders must look for an instant, sharp rebound confirmation, not protracted sideways accumulation, which could signal a deeper probe toward $4000.
B. Position Sizing and Capital Allocation
- Risk Allocation: A conservative and inversely correlated risk approach is recommended. The smallest percentage of trading capital (e.g., 0.5% per trade) should be allocated to the Tactical Short scalping setups, as these are inherently counter-trend and carry higher execution risk.
- Structural Sizing: The largest percentage of capital (e.g., 1.5% to 2.0% risk) should be allocated to the Swing Long position near the $4000 structural support. This trade offers the highest reward-to-risk ratio and is underpinned by the highest conviction fundamental and institutional drivers (Fed rate cuts, sovereign buying).3
- Maximum Exposure: Given the severity of the recent volatility (a 5% single-day drop 2), overall market exposure must be capped at conservative levels. Failure of the $4000 support would require immediate, systemic portfolio rebalancing.
C. Calendar Awareness
The market’s sensitivity will be heightened by speculation and commentary leading up to the October 29 Federal Reserve Meeting. The near 99% expectation of a rate cut 6 means the market will attempt to position aggressively ahead of the event. Until the official statement, XAU/USD price action is expected to remain largely technical, driven by liquidity hunting and consolidation within the defined $4060 – $4193 range.
Works cited
- gold price prediction: Gold Price Forecast: Should buy gold or wait …, accessed on October 25, 2025, https://m.economictimes.com/news/international/us/gold-price-forecast-should-buy-gold-or-wait-for-stabilization-of-prices-heres-price-prediction-for-tomorrow-next-week-next-30-days-factors-affecting-prices-this-month-xau/usd-market-short-term-trading-strategies-u-s-consumer-price-index-macd-rsi-vwap-sma20/articleshow/124763730.cms
- Gold prices tumble 6%, silver cracks over 4% as US-China trade deal hopes spark profit booking. What should investors do?, accessed on October 25, 2025, https://m.economictimes.com/markets/commodities/gold-prices-tumble-6-silver-cracks-over-4-as-us-china-trade-deal-hopes-spark-profit-booking-what-should-investors-do/articleshow/124740652.cms
- Gold tanked, but the next boom could come from Wall Street, Goldman Sachs analysts say – Markets Insider, accessed on October 25, 2025, https://markets.businessinsider.com/news/commodities/gold-price-today-forecast-outlook-wall-street-boom-goldman-sachs-2025-10
- Gold Spot / U.S. Dollar Trade Ideas — FXOPEN:XAUUSD – TradingView, accessed on October 25, 2025, https://www.tradingview.com/symbols/XAUUSD/ideas/?exchange=FXOPEN&sort=recent
- Is gold’s frenzied rally finally winding down?, accessed on October 25, 2025, https://indianexpress.com/article/explained/explained-economics/gold-prices-rally-winding-down-reasons-10322425/
- Should you invest in gold before the October Fed meeting? – CBS …, accessed on October 25, 2025, https://www.cbsnews.com/news/should-invest-in-gold-before-october-2025-fed-meeting/
- Geopolitical Risks Drive Gold Market Safe-Haven Demand – Discovery Alert, accessed on October 25, 2025, https://discoveryalert.com.au/news/geopolitical-risk-impact-gold-market-2025/
- Gold prices surge globally: Exploring the factors behind the rise and market drivers, accessed on October 25, 2025, https://www.nationthailand.com/business/trading-investment/40057289
- Gold’s Golden Glow or a Fleeting Peak? Analyzing XAU/USD’s Volatile Ride | StreetInsider.com – FinancialContent, accessed on October 25, 2025, https://markets.financialcontent.com/streetinsider/article/marketminute-2025-10-24-golds-golden-glow-or-a-fleeting-peak-analyzing-xauusds-volatile-ride
- Gold Price Forecast: Rally Expected to Accelerate into 2026 | Morgan Stanley, accessed on October 25, 2025, https://www.morganstanley.com/insights/articles/gold-price-forecast-rally-into-2026
- Commitments of Traders (COT) Charts – Barchart.com, accessed on October 25, 2025, https://www.barchart.com/futures/commitment-of-traders
- Micro Gold, Silver and Copper Products Report – October 2025 – CME Group, accessed on October 25, 2025, https://www.cmegroup.com/newsletters/micro-gold-silver-and-copper-monthly-update/2025-10-micro-metals-products-report.html
- Gold Spot / U.S. Dollar Trade Ideas — OANDA:XAUUSD – TradingView, accessed on October 25, 2025, https://www.tradingview.com/symbols/XAUUSD/ideas/?exchange=OANDA&sort=recent
Leave a Reply