I. Executive Summary: Signal Generation and Conflict Resolution
The XAU/USD spot market has recently experienced an extraordinary vertical rally, establishing prices well above the $4,100 per ounce threshold, culminating in tests near $4,150.1 This robust ascent is driven by powerful long-term fundamental tailwinds, primarily derived from anticipated dovish shifts by the Federal Reserve and escalating global geopolitical risks.2
However, multi-faceted analysis reveals a critical structural divergence between the overwhelming long-term bullish outlook and an immediate, tactical fragility in short-term positioning. Technical indicators are registering extreme overbought conditions, and speculative futures positioning (COT) demonstrates high saturation, setting the stage for an imminent and necessary price correction.
The primary market conflict is thus defined: unstoppable macro momentum versus fragile short-term crowding. The analysis mandates a dual-strategy approach to capitalize on both the immediate correction potential and the inevitable continuation of the secular bull trend.
Recommended Trading Signal Summary
The immediate “next move” is likely a short-term washout driven by profit-taking and long-liquidation. The strategic objective is to secure long-term value by accumulating positions during this anticipated dip.
| Strategy | Direction | Entry Zone | Stop Loss (SL) | Take Profit (TP) | Risk Profile |
| Tactical | SELL | Breakdown below $4140 | $4185.00 | $4100.00 / $4065.00 | High Volatility, Short-Term |
| Strategic | BUY | Reversal in $4000.00 – $3950.00 Zone | $3920.00 | $4250.00 + | Low Volatility Entry, Long-Term |
II. Deep Fundamental Analysis: Macro Drivers and Tailwinds
The current structural strength of gold is underpinned by a confluence of monetary policy expectations, systemic geopolitical risks, and sustained institutional demand. These factors collectively establish a higher floor for the market, making any future dips highly transient and quickly absorbed.
A. Monetary Policy and Opportunity Cost Dynamics
The primary macro catalyst driving gold’s performance above $4,100 is the market’s firm expectation regarding the Federal Reserve’s monetary policy trajectory. Analysts anticipate a high probability of at least two 25-basis-point rate cuts occurring late in 2025, specifically one in October and another in December.2 This projected easing path fundamentally alters the equation for non-yielding assets like gold.
By reducing the benchmark interest rate, the real yield offered by competing assets, notably US Treasuries, decreases significantly. This reduction in the opportunity cost of holding gold provides a massive structural macro tailwind, enhancing gold’s relative attractiveness to capital.1 Gold’s ability to consolidate its new valuation above the critical $4,100 level, even before these rate cuts materialize, signifies that the market is aggressively pricing in future US Dollar (USD) weakness. This phenomenon reflects proactive hedging against future currency debasement and inflation concerns, reinforcing the strategic importance of the $4,000 and $3,950 supports as robust value anchors.
B. US Dollar Index (DXY) Correlation and Forecast
Gold, being USD-denominated, typically exhibits a strong inverse correlation with the US Dollar Index (DXY). Current DXY data shows the index trading at 99.447.4 Crucially, global macro projections forecast the DXY to drop substantially to 98.426 by the end of the current quarter and further down to 96.543 within one year.4 This aggressive projected decline of approximately 3 points suggests that market consensus is overwhelmingly aligned with persistent USD weakness. A declining DXY directly translates to higher pricing power for USD-denominated commodities, including XAU/USD. This projected USD depreciation is not merely a cyclical expectation; it is baked into the long-term pricing model for gold, providing strong support for the secular uptrend.
C. Geopolitical Risk Premium and Structural Decoupling
The market environment is characterized by intensifying geopolitical tension, identified as a major catalyst for the recent record surge in precious metals.3 Specifically, the renewed and aggressive phase of the US-China trade war has escalated into what analysts term a “supply-chain siege”.3 This involves strategic maneuvers like China’s export restrictions on critical rare earths and the US’s planned response of sweeping 100% tariffs on Chinese imports, effective in November.3
This escalation signifies a long-term structural decoupling rather than temporary trade friction. Such structural shifts guarantee sustained input cost inflation due to less efficient supply chains, alongside continued global economic instability. Investors are responding by flocking to traditional safe havens to hedge against trade friction, persistent fiscal concerns, and systemic instability across other asset classes, notably global equities.1 This elevated geopolitical risk premium is considered sticky, meaning it forms a permanent component of the current gold price valuation and will likely prevent deep, sustained corrective movements below the strong psychological supports of $4,000 and $3,950.
D. Institutional Demand and Economic Calendar Influence
Structural support for XAU/USD is further fortified by sustained institutional accumulation. Emerging-market central banks have maintained a net buyer status for 14 consecutive months, diversifying their reserves away from exclusive USD exposure.1 Moreover, ETF inflows have gained significant momentum, driven by substantial increases in both US and Chinese fund holdings.5 While ETF inflows are traditionally driven by falling real yields, the current demand is also fueled by gold’s hedging benefits against the unique combination of inflation and growth risks present in the current environment.5
Regarding near-term catalysts, the crucial US Consumer Price Index (CPI) report, a key inflation metric, is currently delayed until October 24th.6 This delay creates a short-term data vacuum, allowing momentum to persist but simultaneously increasing market volatility as speculative activity attempts to fill the void until concrete inflation figures are released.
III. Technical Structure and Price Action Analysis (H1, H4, Daily)
The technical structure of XAU/USD confirms an extraordinary vertical rally, yet the immediate price action on the hourly (H1) chart suggests profound short-term exhaustion, setting the scene for a corrective maneuver.
A. Trend Identification and Momentum Saturation
The price trajectory since May has been characterized by a near-uninterrupted, parabolic ascent from below $3,200 to over $4,130.1 This rapid, high-volatility climb is a classic sign of speculative momentum. However, this relentless upward motion has pushed momentum indicators deep into extended territory.1 Critically, analysis of the monthly timeframe reveals an Relative Strength Index (RSI) reading exceeding 90+, an extreme condition that traditionally signals severely overheated territory and high vulnerability to a substantial price correction due to mandatory profit booking.7
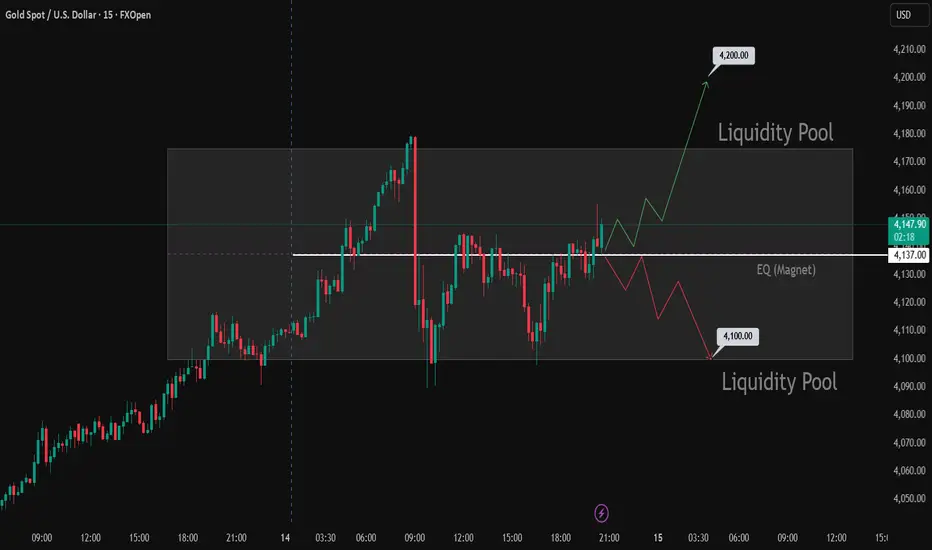
On the immediate H1 chart, the price action coiling near the high (around $4,149) is failing to decisively clear the immediate resistance. Recent candles display noticeable upper wicks.1 These wicks are definitive technical signatures that indicate intraday attempts to extend the rally are being aggressively met by selling pressure, confirming that distribution and profit-taking are beginning to take hold near the record highs.
B. Critical Support and Resistance Mapping
The current price structure necessitates close monitoring of key technical boundaries to identify the point of short-term trend reversal and the optimal entry for strategic accumulation.
Table 1: XAU/USD Multi-Timeframe Key Levels and Bias
| Timeframe | Trend Bias | Key Resistance (R) | Primary Support (S) | Immediate Action Point |
| H1 (Intraday) | Neutral/Weak Bullish | $4170 – $4180 | $4100 – $4090 | Watch for failure at $4140/Rejection from R1 8 |
| H4 (Short-Term) | Strong Bullish | $4230 | $4065 | Potential immediate pullback target validated by volatility 7 |
| Daily (Mid-Term) | Vertical Bullish | N/A (Record Highs) | $3950 | Long-term strategic buying zone 1 |
The most immediate ceiling is the historical high zone between $4170 and $4180 (R1).8 Failure to break this level confirms the corrective outlook. The primary H1 support (S1) lies at $4100-$4090 8, representing the psychological barrier and immediate consolidation floor. A sustained close below $4,100 is the technical trigger that would confirm the corrective phase is underway, likely extending the pullback toward the key defense level at $4065.8
C. Technical Risk Assessment and Liquidity Dynamics
The vertical rally structure has created a market susceptible to sudden, sharp drawdowns. Historical price behavior in this elevated environment suggests that technical pullbacks following rapid spikes can reach magnitudes of up to $80 in a single trading session, particularly following the “Monday opening jump” pattern.8
The emergence of upper wicks coupled with the stalling price near $4150 is a strong indicator of institutional distribution—Smart Money selling into the retail/speculative euphoria. This liquidity grab near the $4170-$4180 resistance zone effectively traps late long entrants, thereby increasing the concentration of stop-losses just below the immediate consolidation levels (e.g., $4140 and $4100). This setup increases the probability of a swift, sharp reversal intended to “sweep” the liquidity pool created by these stops.
Despite this immediate risk, the long-term price structure remains robust. Projections based on advanced wave analysis suggest that gold maintains potential to reach targets exceeding $4700 in the coming months.7 This long-term outlook reinforces the principle that any technical correction, even a deep one, should be treated as a value opportunity for strategic, structural long accumulation, provided the critical structural support zone of $3950 is successfully defended.1
IV. Sentiment and Positioning Analysis (COT Deep Dive)
The Commitment of Traders (COT) report provides a vital snapshot of the positioning of large market participants, specifically non-commercial traders (speculators). Analysis of this data reveals an extreme saturation level, which forms the empirical basis for the immediate tactical sell signal.
A. Non-Commercial Positioning Extremity
The COT report is published weekly by the CFTC and tracks futures positions, offering critical signals regarding market dynamics and potential reversals.9 The latest available data highlights a significant accumulation of long positions by large speculators.
Table 2: Commitment of Traders (COT) Non-Commercial Data Summary
| Release Date | Non-Commercial Net Position (Contracts) | Change from Previous Week (K) | Historical Interpretation |
| Sep 26, 2025 | 266.7K | +0.3K | Extreme High Speculative Long Exposure 10 |
| Sep 19, 2025 | 266.4K | +4.7K | Continued accumulation 10 |
| Sep 12, 2025 | 261.7K | +12.2K | Aggressive positioning increase 10 |
As of September 26, 2025 (W39), the US Gold Non-Commercial Net Position stood at a highly elevated 266,749 contracts.10 This figure represents a considerable escalation from positions earlier in the summer (214.3K in late August).10 Historically, any net long exposure exceeding 250K contracts is interpreted as high saturation or a “crowded trade.”
B. The Risk of Long Liquidation (The Crowded Trade)
The significance of this extreme net long position is twofold:
- Limited Fuel for Continuation: When the majority of large speculative capital is already committed to the long side, there is inherently limited capital remaining to inject into the market to sustain the vertical rally. Any sustained resistance will immediately prompt profit-taking.
- Increased Volatility Risk: High speculative concentration dramatically increases the risk of a sharp liquidation event, often termed a “long squeeze.” Should the price break key tactical supports (e.g., $4100 or $4065), the automatic stop-loss orders of these crowded longs will trigger, generating rapid, high-velocity selling that feeds upon itself and exacerbates the downward move.9
Furthermore, recent strong inflows into spot ETFs signal renewed retail and passive institutional participation.1 These late-stage entrants often possess less conviction than early-stage investors, making them prime candidates for panic selling during a drawdown. This confluence of extreme speculative futures positioning and late retail participation creates a market dynamic that is extremely fragile, necessitating a corrective phase to “wash out” the weak hands and reset momentum indicators before a sustainable push to new highs can occur.
V. Synthesis of Conflicting Signals and Risk Assessment
The analysis requires a detailed reconciliation of the dominant fundamental strength and the critical technical/sentiment weakness. The outcome of this synthesis dictates the sequencing of the short-term and long-term trading strategies.
A. The Structural Bull vs. Tactical Bear Conflict
The structural thesis for gold, driven by anticipated lower real yields 2 and permanent geopolitical instability 3, is overwhelmingly bullish. This structural strength guarantees that the long-term trend remains intact, targeting potential extensions toward $4250 and beyond, with $4700+ being a macro objective.1
However, the tactical market environment is highly unstable. The combination of the monthly timeframe RSI being deeply overbought (90+ reading) 7 and the COT report showing non-commercial net long positions at 266.7K contracts 10 generates an acute “wedge” of fragility. This condition suggests that the next immediate move is not a breakout, but a corrective retreat to $4065-$4000 to re-establish market balance. This deleveraging process is essential for the long-term health of the rally.
B. Scenario Analysis for Near-Term Price Action
The most probable path forward is a tactical correction (Scenario B), given the technical warnings and extreme speculative crowding.
| Scenario | Condition | Likely Target | Probability | Action |
| A: Continuation | Sustained close above R1 ($4180). | $4230 – $4250 | Low (due to exhaustion) | Move Stop Loss higher, monitor R2. |
| B: Correction (Base Case) | Failure to hold $4140, H1 close below S1 ($4100). | $4065 – $4000 | High (Validated by COT/RSI) | Initiate Tactical Short. |
| C: Washout/Deep Liquidation | Breakdown and close below $4000. | $3950 – $3900 | Moderate (If panic hits late retail) | Prepare Strategic Long Entry. |
C. Risk and Execution Protocol
The parabolic nature of the recent move necessitates disciplined risk management. The anticipated corrective move will likely be high velocity, leveraging the stop-losses of late long positions. Historical data warns of potential single-day drawdowns of up to $80.8 Therefore, for the tactical short trade, reduced position sizing (maximum 1.0% risk per trade) is mandatory, and stop-loss levels must be strictly adhered to, positioned tightly above the $4180 resistance zone. Furthermore, the market must be monitored closely around the rescheduled high-impact US CPI report on October 24th, as new data could dramatically accelerate or prematurely end the corrective phase.6
VI. Detailed Trading Recommendation and Implementation Plan
The comprehensive analysis concludes with a two-part signal designed to capture both immediate volatility and long-term structural appreciation.
A. Tactical Signal: Short-Term Corrective Trade (SELL)
The objective is to profit from the short-term profit-taking and long liquidation phase triggered by extreme overbought conditions and overcrowded positioning.
Entry Conditions
The primary entry signal is confirmed upon the price breaking below the immediate H1 consolidation floor at $4140.00. This breakdown confirms that selling pressure observed in the upper wicks is gaining control. A secondary entry opportunity exists if the price attempts to retest the $4170–$4180 resistance zone and forms a distinct bearish reversal pattern.
Parameters
| Parameter | Value | Rationale |
| Trade Direction | SELL (Short Position) | Capitalizing on overbought/crowded sentiment.7 |
| Entry Confirmation | Break and H1 close below $4140.00 | Confirms short-term momentum shift and liquidity sweep activation. |
| Stop Loss (SL) | $4185.00 | Placed above the critical historical high resistance R1 ($4170-$4180).8 |
| Take Profit 1 (TP1) | $4100.00 | Retest of the immediate psychological and structural support S1.8 |
| Take Profit 2 (TP2) | $4065.00 | Targetting the key defense level and H4 support.8 |
B. Strategic Signal: Long-Term Entry (BUY)
The objective is to establish strategic long positions at superior value prices, leveraging the powerful fundamental tailwinds.
Entry Conditions
Strategic accumulation should commence only once the market shows signs of stabilization and reversal within the designated support zone. This means waiting for a clear reversal pattern (e.g., a bullish engulfing candle or a confirmed retest of the breakout zone) on lower timeframes (M5/M15).12
Parameters
| Parameter | Value | Rationale |
| Trade Direction | BUY (Long Position) | Structural positioning aligned with Fed easing and geopolitical risk.2 |
| Entry Zone | $4000.00 – $3950.00 | Key structural retest area S2.1 Prior strong resistance now acts as reinforced support. |
| Stop Loss (SL) | $3920.00 | Below the long-term structural breakout zone. |
| Target 1 (T1) | $4180.00 | Reclaiming immediate historical highs. |
| Target 2 (T2) | $4230.00 – $4250.00 | Extended Fibonacci/Psychological Targets.1 |
C. Position Management Protocol
Strategic Long positions should be scaled into the $4000-$3950 zone using a dollar-cost averaging (DCA) approach. The largest portion of the trade should be executed only after the market displays confirmation of rejection from the support floor, confirming the successful “washout” of weak longs. The $3950 level represents the critical failure point for the current structural bull thesis; a sustained close below this level would require a re-evaluation of the long-term outlook.
Works cited
- Gold Surges to Record Highs Above $4,100 — But Is the Rally Overheating? | Investing.com, accessed October 14, 2025, https://www.investing.com/analysis/gold-surges-to-record-highs-above-4100–but-is-the-rally-overheating-200668484
- accessed October 14, 2025, https://markets.financialcontent.com/stocks/article/marketminute-2025-10-14-gold-shatters-records-surging-above-4100oz-amid-fed-rate-cut-frenzy-and-global-instability#:~:text=The%20primary%20drivers%20will%20continue,opportunity%20cost%20of%20holding%20gold.
- Gold and Silver Soar to Record Highs Amid Intensifying US-China Trade War and Global Market Turmoil | FinancialContent, accessed October 14, 2025, https://markets.financialcontent.com/stocks/article/marketminute-2025-10-14-gold-and-silver-soar-to-record-highs-amid-intensifying-us-china-trade-war-and-global-market-turmoil
- DXY Dollar Index – Currency Exchange Rate Live Price Chart – Trading Economics, accessed October 14, 2025, https://tradingeconomics.com/dxy:cur
- A new high? | Gold price predictions from J.P. Morgan Research, accessed October 14, 2025, https://www.jpmorgan.com/insights/global-research/commodities/gold-prices
- Gold (XAU/USD) Price Eyes Acceptance Above $4100/oz on US-China Trade War Fears, Up 2% on the Day – MarketPulse, accessed October 14, 2025, https://www.marketpulse.com/markets/gold-xauusd-price-eyes-acceptance-above-4100oz-on-us-china-trade-war-fears-up-2-on-the-day/
- Gold Spot / U.S. Dollar Trade Ideas — EASYMARKETS:XAUUSD – TradingView, accessed October 14, 2025, https://in.tradingview.com/symbols/XAUUSD/ideas/?exchange=EASYMARKETS
- Gold Spot / U.S. Dollar Trade Ideas — OANDA:XAUUSD – TradingView, accessed October 14, 2025, https://www.tradingview.com/symbols/XAUUSD/ideas/?sort=recent
- Gold COT Data: Latest Index – InsiderWeek, accessed October 14, 2025, https://insider-week.com/en/cot/gold/
- CFTC Gold speculative net positions – Investing.com, accessed October 14, 2025, https://www.investing.com/economic-calendar/cftc-gold-speculative-positions-1618
- US – Gold – Non Commercial Net Position | Series – MacroMicro, accessed October 14, 2025, https://en.macromicro.me/series/3071/cot-gold-noncommercial
- XAUUSD Hits Record High. Is a Gold Correction Imminent? – FBS, accessed October 14, 2025, https://fbs.com/market-analytics/market-insights/xauusd-hits-record-high-is-a-gold-correction-imminent-
- XAUUSD Breakout and Retest Strategy | PDF | Gold As An Investment – Scribd, accessed October 14, 2025, https://www.scribd.com/document/884000226/XAUUSD-Breakout-and-Retest-Strategy
- Complete Step-by-Step Guide to Day Trading Gold (XAU/USD) with Smart Money Concepts (SMC) – ACY Securities, accessed October 14, 2025, https://acy.com/en/market-news/education/complete-stepbystep-guide-to-day-trading-gold-xauusd-with-smart-money-concepts-smc-j-o-161926/
Leave a Reply