Executive Summary and Signal Recommendation
Gold (XAU/USD) is presently defined by a critical conflict between profound structural strength and acute technical overextension. Fundamentally, the market is confirmed to be in a secular bull phase, supported by sustained central bank acquisitions, geopolitical uncertainty, and forward pricing of significant US Federal Reserve monetary easing. This combination provides a robust long-term floor for the price.1
However, short-term momentum is severely hampered by extreme speculative crowding. Analysis of the Commitment of Traders (COT) report and retail sentiment indices reveals a highly leveraged market vulnerable to a rapid liquidation event. Non-Commercial net long positions are positioned near historical highs, matched by overwhelming retail bullish conviction (67% net long).3 This configuration suggests that any immediate attempt to breach resistance levels above $4,070 is likely to fail, resulting in a swift corrective decline to flush out weak speculative hands.
The resulting strategy is to avoid chasing the current volatile price action and instead capitalize on the expected tactical correction. The actionable recommendation is to initiate a LONG position only upon retesting established key support levels, thereby aligning the entry with the dominant fundamental trend at a maximized risk/reward ratio.
| TICKER | SIGNAL | RATIONALE |
| XAU/USD | BUY THE DIP (LONG) | Wait for speculative liquidation to key structural support ($3,921 – $3,905) to align with overwhelming structural (Central Bank/Monetary) bullish drivers. |
Section I: Fundamental Analysis – Macro Drivers and Structural Demand Profile
1.1. Monetary Policy: The Engine of Gold’s Valuation
The primary catalyst supporting the elevated valuation of gold is the forward pricing of US Federal Reserve monetary policy shifts. Current market consensus anticipates multiple interest rate cuts, with expectations suggesting two cuts by the end of the year.5 This reduction in the federal funds rate is crucial because it directly lowers the opportunity cost of holding non-yielding assets such as gold. As bond yields, particularly on US Treasuries and other government bonds, decline, gold becomes increasingly attractive as a financial asset.6 This mechanism removes a traditional headwind for gold investment.
Furthermore, the anticipated loosening of monetary policy directly impacts the US Dollar (USD) valuation. Expectations of lower rates tend to exert downward pressure on the USD.2 Since gold is priced in the USD, a weaker dollar intrinsically enhances the purchasing power of other currencies, leading to increased demand for gold and potentially higher XAU/USD prices.7 The interplay between anticipated rate cuts, decreasing yields, and a weaker dollar establishes a robust long-term framework favoring continued upward movement in gold prices.
While the structural trajectory is defined by monetary easing expectations, the short-term market sensitivity remains linked to incoming economic data. Strong positive employment data, such as a robust Non-Farm Payroll (NFP) report, or unexpected inflationary moderation, could suggest a stronger US economy. Such evidence may lead to expectations of tightening monetary policy or delayed rate cuts.7 Any perception that the Fed will defer easing could strengthen the USD and trigger short-term downward pressure on gold prices, underscoring the necessity of a patient, tactical entry strategy rather than purchasing near current highs.
1.2. Structural Regime Change and New Valuation Paradigms
A detailed examination of analyst forecasts reveals a critical disparity that suggests the market is undergoing a structural revaluation of gold, moving beyond mere cyclical hedges. The current trading price for gold, hovering near the $4,000 per ounce mark, stands in stark contrast to the average analyst forecast for 2024, which clustered significantly lower, ranging from approximately $1,947 to $2,140.8 This vast difference implies that the market is incorporating factors far more powerful than typical interest rate cycles.
This new valuation paradigm is supported by institutional research, with institutions like Goldman Sachs predicting gold will rise to $4,000 per troy ounce by the middle of the following year.1 This elevated target is driven by strong, persistent structural demand from central banks and anticipated easing from the US Federal Reserve, which supports ETF demand.1 The sustained institutional participation, particularly from long-term institutional buyers and global central banks rather than transient speculators, suggests that the market is no longer viewing gold solely as a cyclical inflation hedge, but as a crucial, high-level safe-haven asset in an increasingly uncertain global financial environment. Consequently, any sharp price pullbacks should be interpreted as technical corrections within a secular upward trend, presenting strategic buying opportunities rather than signs of a trend reversal.
1.3. Geopolitical Uncertainty and Physical Demand
The gold market continues to benefit significantly from geopolitical and political risk premiums. Elevated geopolitical risks and uncertainty surrounding international trade policy, including unresolved tariff rates, contribute to uncertainty in global exchange rates.9 This environment makes gold a more attractive store of value relative to sovereign currency-denominated assets, such as short-term government bonds.9 Furthermore, internal US political instability, such as the potential for government shutdowns and resulting economic drag, naturally boosts demand for traditional safe-haven assets.5
Beyond institutional flows, physical demand provides a robust underlying support layer. India, the world’s second-biggest consumer of the precious metal, has shown extraordinary resilience to record high prices. Trade sources indicate that India’s imports of gold nearly doubled in September compared to August, driven by banks and jewelers rushing to build inventories ahead of the critical festive season.5 The Indian festive season, commencing in October (leading up to Diwali), is considered an auspicious time for purchasing gold and is likely to generate strong retail demand.5 This aggressive front-running of the festive consumption period provides immediate and tangible physical support, suggesting any deep pullbacks will encounter significant buying interest from the world’s most price-sensitive consumers. The overall rally is fundamentally supported by institutional longevity, reducing the likelihood that any pullbacks will be prolonged or structurally damaging.5
Section II: Technical Analysis – Price Structure, Momentum, and Key Levels
2.1. Interpretation of Recent Price Action and Momentum
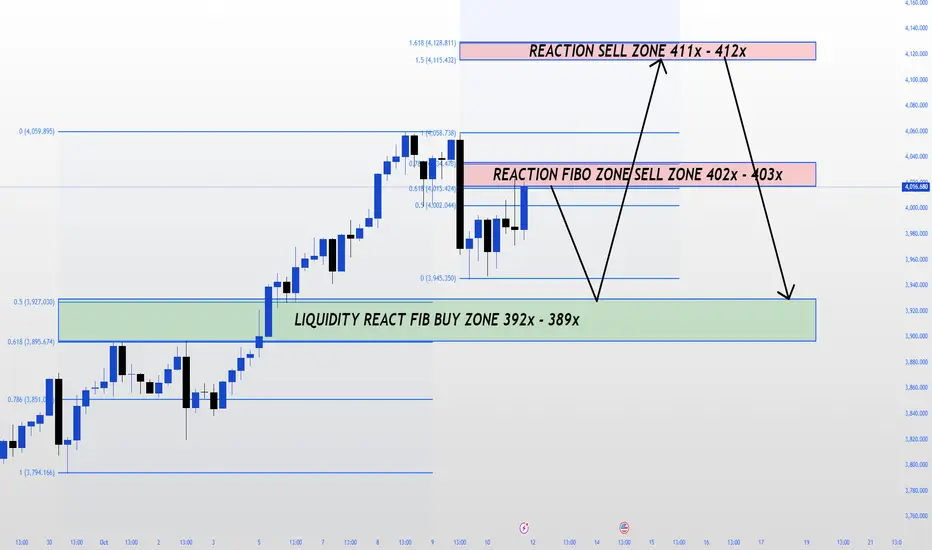
Analysis of the XAU/USD 1-hour candlestick chart reveals critical short-term dynamics. The price successfully established new highs, peaking near the $4,040 level, but immediately met significant resistance, resulting in a sharp, multi-candlestick rejection from these highs. This violent price action confirms the presence of strong institutional supply or early profit-taking, indicating a current inability to sustain a breakout above the $4,000 psychological zone. The current trading phase is characterized by volatile consolidation, often marked by large wicks, suggesting intense internal conflict between short-term buyers attempting to defend gains and sellers imposing pressure.
Momentum indicators confirm this technical pause. The Moving Average Convergence Divergence (MACD) indicator visible on the chart shows that the strong bullish momentum established during the previous uptrend has been decisively reversed following the peak and subsequent decline. The indicator is currently centered near the zero line, visually confirming neutral-to-bearish short-term momentum.11 To confirm a bullish continuation, the price would require a fresh, sustained MACD bullish crossover, with the MACD line rising definitively above its signal line. Currently, the technical setup confirms short-term exhaustion and vulnerability.
2.2. Critical Support and Resistance Clusters
The short-term price trajectory will be defined by the market’s reaction to established pivot points and derived support and resistance levels. The price is currently oscillating around its technical pivot point (approximately $3,956.71).12 Sustained failure to hold above this level would confirm the immediate bearish short-term bias.
Immediate resistance is clustered tightly, representing zones of prior supply and potential profit-taking. This resistance starts near the derived ceilings of $4,073.65 (the Price 3 Standard Deviations Resistance/14-Day RSI 80% ceiling) and extends to the critical technical level of $4,117.70 (Pivot Point 3rd Level Resistance).12 A definitive, high-volume breach and hold above $4,117.70 would trigger the next major structural upward impulse, suggesting that this level will be heavily defended by short positions.
The most critical factor in the immediate outlook is the defense of key support zones, which define the high-probability entry strategy. Immediate support is situated at $3,921.51 (Pivot Point 2nd Support Point), followed by the crucial defensive line at $3,895.04 (Pivot Point 3rd Support Point).12 Maintaining price action above the $3,895 level is paramount to preserving the structural integrity of the recent uptrend. A failure below this floor would suggest a deeper correction is underway, potentially toward the next major psychological support in the $3,800 range. The strong rejection from $4,040, combined with extreme leveraged positioning (as detailed in Sections III and IV), suggests that the market lacks the necessary liquidity to breach upper resistance without first testing these support levels to clear speculative long exposure.
Key Technical Support and Resistance Levels (XAU/USD)
| Level Type | Price (Approximate) | Role/Significance | Source |
| Primary Resistance (R2) | $4,117.70 | Structural Breakout Target (Pivot Point 3rd Level Resistance) | 12 |
| Immediate Resistance (R1) | $4,073.65 – $4,081.86 | Near-Term Supply Zone; RSI/Deviation Ceiling | 12 |
| Pivot Point (PP) | $3,956.71 | Center of Current Volatile Trading Range | 12 |
| Immediate Support (S1) | $3,921.51 | Key Buy-the-Dip Entry Zone (Pivot Point 2nd Support) | 12 |
| Primary Support (S2) | $3,895.04 | Structural Defense Line; Failure risks trend reversal | 12 |
Section III: Commitment of Traders (COT) Analysis – Institutional Positioning
3.1. Extreme Non-Commercial Net Positioning and Liquidation Risk
The Commitment of Traders (COT) report provides essential insights into the positioning of speculative capital, offering a window into the market’s leverage profile. The latest data for 2025 Week 39 shows the US – Gold – Non Commercial Net Position standing at a highly significant level of 266,749.00 contracts.3 Non-Commercial traders primarily consist of large speculators, such as hedge funds and institutional trading programs, whose activity is crucial for short-term directional movement.
This substantial net positive position (266.7k) indicates that speculative interest is overwhelmingly aligned on the long side. Historically, such high levels of net long exposure signify a “crowded trade,” where most sophisticated short-term money has already been deployed. This high concentration of long positions creates substantial overhang risk. The mechanism of concern is straightforward: should the price decline, even marginally, stop-loss orders from these highly leveraged speculators will be triggered. This simultaneous liquidation by large market participants results in a rapid, cascading wave of selling pressure that can accelerate the downward move, often producing a correction that is disproportionate to the actual news catalyst.
The COT data thus functions as a powerful tactical indicator. While the fundamentals (Central Bank buying) provide structural support, the current configuration of speculative leverage dictates the immediate market risk. The high speculative involvement confirms that the gold market is currently too heavy with long exposure to ascend efficiently. A significant decline is likely required to reduce the speculative net long exposure to more neutral levels, thereby establishing a necessary deleveraged base from which a new, structurally sound rally can be launched.
Section IV: Sentimental Analysis – Contrarian Signals and Retail Flow
4.1. Retail Sentiment Index as a High-Conviction Warning
Further evidence of market crowding comes from retail positioning data. The latest client sentiment data shows a strong surge in bullish conviction among retail traders, with heavy buying in gold rising to 67% net long, an increase from 63% the week prior.4 Retail market commentators confirm this, noting that clients are showing “clear conviction in gold,” classifying it as “firmly in buy territory”.4
In the context of leveraged trading in commodities, extreme retail conviction often functions as a powerful contrarian signal. When the vast majority of retail accounts are committed to one direction (67% net long), it typically suggests that the pool of potential new retail buyers is approaching exhaustion. There is little uncommitted capital left to fuel continued upward movement, making the market susceptible to aggressive short-term moves by larger institutional players who seek to profit from flushing out these weaker, leveraged positions.
4.2. Amplified Risk from Synchronized Crowding
The confluence of extreme positioning in both the sophisticated (COT, Non-Commercial) and momentum-driven retail categories creates a rare and amplified short-term warning. The simultaneous leveraging long across both speculative tiers means that the market is acutely vulnerable to a synchronized exit. If a technical level breaks or an adverse economic release occurs, both groups are incentivized to liquidate quickly to protect capital. This unified crowding amplifies the risk of a swift, deep, and rapid corrective wash-out, a necessary technical reset before the next major advance. Therefore, the immediate directional pressure, driven by sentiment and positioning dynamics, is strongly oriented toward the downside, seeking liquidation.
Section V: Synthesis, Risk Assessment, and Trading Strategy
5.1. Conflict Resolution: Structural Bull vs. Tactical Crowding
The comprehensive analysis establishes a clear strategic divergence. The long-term thesis is unequivocally bullish, underpinned by irreversible factors: expectations of lower US interest rates, geopolitical instability, rising inflation hedges, and sustained high-level purchases by Central Banks and long-term institutions.1 These elements ensure a resilient price floor and a high probability of new all-time highs in the medium to long term.
Conversely, the short-term tactical view is dominated by extreme overextension. The technical indicators suggest momentum exhaustion following the failure near $4,040, while the quantitative analysis of speculation (COT at 266.7k) and retail sentiment (67% net long) confirms an imminent risk of a sharp deleveraging event.3
The resolution of this conflict dictates the optimal entry strategy: rather than fighting the inevitable short-term liquidation, a prudent approach requires patience to capture the long-term trend at a far more advantageous price point. The highest-probability strategy is to Buy the Dip, leveraging the expected volatility to secure an entry near strong structural support where institutional buyers are likely to defend the price aggressively.
5.2. Risk Scenarios and Mitigation
| Risk Scenario | Implication for Gold | Mitigation Strategy | Source |
| Upside Risk: Geopolitical Escalation or Faster Fed Easing | Accelerated breakout above $4,117, bypassing the desired support test. | Requires a strategy shift: wait for confirmed retest and hold above $4,117 to initiate a long position with a tight stop. | 9 |
| Downside Risk 1: US Data Improves (NFP/CPI) | Deferred rate cuts, strong USD, potentially triggering a sharp drop below primary support ($3,895). | Adhere strictly to the defined stop-loss at $3,880.00. The long-term fundamental catalyst (need for easing) is likely delayed, not canceled. | 7 |
| Downside Risk 2: Extreme Long Liquidation (COT) | Flash crash/washout toward deeper psychological support ($3,800). | Employ limit orders at suggested entry zones to capitalize on potential rapid wicks and ensure entry during periods of extreme short-term selling. | 3 |
5.3. Final Signal and Trade Execution Plan
The strategy is focused on capturing the bounce from a technical reset. By patiently waiting for the price to drop into the designated support range ($3,921-$3,905), the execution plan achieves a superior risk/reward ratio. This approach strategically capitalizes on the expected liquidation of short-term speculative exposure, positioning the trade close to the protective floor established by long-term fundamental demand.
| Parameter | Value | Rationale |
| Trade Direction | LONG (Buy) | Structural fundamentals remain bullish; leveraging anticipated shakeout. |
| Optimal Entry Zone | $3,921.51 – $3,905.00 | Immediate support cluster identified by technical pivot points (S1/S2).12 |
| Stop Loss (S/L) | $3,880.00 | Places the stop below the key structural defense line of $3,895.04 to protect against significant trend reversal.12 |
| Take Profit 1 (TP1) | $4,070.00 | Targeting immediate resistance cluster (R1) and prior peak failure zone. |
| Take Profit 2 (TP2) | $4,117.00 | Targeting major technical breakout level (R2) for confirmation of renewed structural move.12 |
| Market Condition | Patience Required | High probability of volatility and a temporary short-term decline before the structural advance continues. |
Works cited
- Gold Is Forecast to Rise 6% by the Middle of 2026 | Goldman Sachs, accessed on October 12, 2025, https://www.goldmansachs.com/insights/articles/gold-forecast-to-rise-by-the-middle-of-2026
- Gold’s Price Rally: More to Come? – ETF Trends, accessed on October 12, 2025, https://www.etftrends.com/gold-silver-investing-channel/golds-price-rally-more-come/
- US – Gold – Non Commercial Net Position | Series | MacroMicro, accessed on October 12, 2025, https://en.macromicro.me/series/3071/cot-gold-noncommercial
- Retail Trading Data Show Heavy Buying in Gold and Rising …, accessed on October 12, 2025, https://mid-east.info/retail-trading-data-show-heavy-buying-in-gold-and-rising-optimism-across-us-indices/
- Gold price prediction today: Will gold prices continue to rise ahead of Diwali? Why investors should buy on dips, accessed on October 12, 2025, https://timesofindia.indiatimes.com/business/india-business/gold-price-prediction-today-india-where-is-gold-silver-rate-headed-on-october-08-2025-mcx-gold-futures-outlook/articleshow/124376136.cms
- Here’s what gold crossing $4,000 is telling us about the U.S. economy – CBS News, accessed on October 12, 2025, https://www.cbsnews.com/news/why-is-the-price-of-gold-rising-4000-ounce-economy/
- How NFP Affects Gold Prices: Key Factors & Trading Insights – Blueberry Markets, accessed on October 12, 2025, https://blueberrymarkets.com/market-analysis/how-does-nfp-affect-the-price-of-gold/
- Analysts forecasts | LBMA, accessed on October 12, 2025, https://www.lbma.org.uk/forecast-survey-2024/analysts-forecasts
- Gold hits new heights. An expert explains what is pushing up the price, accessed on October 12, 2025, https://news.northeastern.edu/2025/10/09/should-you-buy-gold-2025/
- Gold price tops $4,000 for first time as investors seek safe haven, accessed on October 12, 2025, https://www.theguardian.com/business/2025/oct/07/gold-futures-prices-economy
- XAUUSD Technical Analysis Today | XAUUSD Forecast | IFCM UK – IFC Markets, accessed on October 12, 2025, https://www.ifcm.co.uk/technicals/precious-metals-technical-analysis/xauusd
- XAUUSD Trader’s Cheat Sheet for Gold Forex – Barchart.com, accessed on October 12, 2025, https://www.barchart.com/forex/quotes/%5EXAUUSD/cheat-sheet
Leave a Reply