I. Executive Summary
This report presents a comprehensive, multi-disciplinary analysis of the Bitcoin market as of Q4 2025. It integrates fundamental, sentimental, technical, and institutional positioning data to derive a high-probability trading signal. The analysis reveals a powerful confluence of bullish catalysts. A dovish macroeconomic environment, characterized by monetary easing and persistent inflation, is acting as a significant tailwind. This is amplified by a structural shift in market dynamics, driven by unprecedented institutional adoption via spot Exchange-Traded Funds (ETFs) and a corresponding supply squeeze on exchanges.
The primary findings of this report are as follows:
- Fundamental: The macroeconomic backdrop, including recent Federal Reserve rate cuts and above-target inflation, combined with a newly clarified U.S. regulatory landscape following the passage of the GENIUS Act, is fundamentally bullish for Bitcoin’s narrative as a non-sovereign store of value.1
- On-Chain/Supply: Massive, ETF-driven demand is colliding with a six-year low in Bitcoin reserves on exchanges, creating the classic conditions for a potential supply shock where a small increase in demand can lead to an outsized price impact.3
- Sentiment: The current “Neutral” market sentiment, indicated by a Crypto Fear & Greed Index reading of 58, suggests that the market has not yet reached a state of euphoric excess. This indicates substantial room for further price appreciation before a major market top is formed.5
- Technical: The price has successfully broken out to a new all-time high, and the subsequent consolidation above the critical $120,000 support level is indicative of a healthy, sustainable uptrend, confirmed by multiple bullish indicators.7
Based on the overwhelming weight of evidence presented across these analytical pillars, this report issues a BUY signal for Bitcoin (BTC/USD). The trade is predicated on the continuation of these identified trends. Specific entry, stop-loss, and take-profit levels are detailed in Section VIII to provide a complete and actionable framework.
II. The Macro-Fundamental Landscape: A Conducive Environment for Digital Assets
The current strength in the Bitcoin market is not occurring in a vacuum. It is underwritten by a foundational shift in the global macroeconomic and regulatory environment, creating conditions that are uniquely favorable for a scarce, decentralized, non-sovereign monetary asset.
2.1 Analysis of U.S. Monetary Policy: The Fed’s Dovish Pivot
The U.S. Federal Reserve’s recent policy actions serve as a primary catalyst for capital allocation into alternative assets. The Federal Open Market Committee (FOMC) executed a 25 basis point interest rate cut at its September 2025 meeting, bringing the federal funds rate target range down to to .1 The effective rate has since stabilized around .9 More importantly, the committee’s forward guidance has signaled the potential for two additional rate cuts within the year, marking a decisive pivot from monetary tightening to an easing cycle.1
This policy shift is a direct response to emerging weakness in the U.S. economy, particularly in the labor market, where the unemployment rate has ticked up to 4.3% and nonfarm payroll growth has slowed significantly.11 For asset allocation, the implications are profound. Lower interest rates decrease the opportunity cost of holding non-yielding assets like Bitcoin and gold. When returns on traditional “safe” assets like government bonds decline, investors are incentivized to move further out on the risk spectrum in search of higher returns. This dovish stance actively encourages capital to flow into assets perceived as hedges against currency debasement and systemic financial risk.
The decision to cut rates while inflation remains above the central bank’s target reveals a critical policy priority. It signals to the market that the Federal Reserve is willing to tolerate inflation to support employment and economic growth. This perception directly fuels the “debasement trade” narrative, where investors seek refuge from the eroding purchasing power of fiat currencies.8 This dynamic positions Bitcoin, with its algorithmically fixed supply, as a prime beneficiary of declining confidence in the U.S. dollar’s long-term value.
2.2 Inflationary Pressures and Currency Debasement
Despite the Fed’s easing stance, inflationary pressures persist. The latest headline Consumer Price Index (CPI) for the twelve months ending August 2025 registered at 2.9%.14 While this figure is a significant reduction from the multi-decade highs seen previously, it remains stubbornly above the Fed’s stated 2% long-term target. This environment of “creeping” inflation systematically erodes the value of savings held in cash and other fiat-denominated instruments.16
This dynamic forces investors to seek assets capable of preserving or growing their purchasing power over time. Bitcoin’s core value proposition—its programmatic scarcity and immutable supply cap of 21 million coins—offers a compelling alternative to the endlessly expandable supply of government-issued currencies. This has solidified its narrative as a “store of value” and a form of “digital gold,” attracting capital from investors concerned about long-term wealth preservation.4 The appeal is further magnified by the concurrent weakness in the U.S. dollar index, which has declined by 10% year-to-date, making dollar-denominated assets like Bitcoin more attractive to international buyers.8 The combination of a dovish central bank and persistent inflation creates a powerful positive feedback loop for Bitcoin, validating its core thesis for a widening base of investors who now view it as a necessary portfolio diversifier.
2.3 The Regulatory Thaw: De-Risking the Asset Class
For years, regulatory uncertainty has been the single greatest impediment to widespread institutional adoption of digital assets. The landscape in 2025, however, has undergone a seismic shift toward clarity, significantly de-risking the asset class for conservative capital allocators. A key development was President Trump signing the Guiding and Establishing National Innovation for U.S. Stablecoins (GENIUS) Act into law in July 2025.2 This landmark legislation establishes the first comprehensive federal framework for payment stablecoins, mandating 1:1 backing with high-quality liquid assets and regular public disclosures.19
Simultaneously, the Digital Asset Market Clarity Act (CLARITY Act), which aims to provide a clear jurisdictional framework between the Securities and Exchange Commission (SEC) and the Commodity Futures Trading Commission (CFTC), has successfully passed the House of Representatives and is now pending in the Senate.18 This legislative progress, driven by a pro-innovation stance from the current administration, is replacing a patchwork of ambiguous and often conflicting rules with a coherent national strategy.20
This newfound regulatory clarity is the foundational layer required for the full-scale integration of digital assets into the traditional financial system. It provides the legal and compliance certainty that major institutions—such as banks, pension funds, and large asset managers—require before committing significant capital.19 By legitimizing key components of the crypto ecosystem like stablecoins, the GENIUS Act paves the way for their use in mainstream payments, corporate treasury management, and cross-border settlements, thereby embedding digital asset infrastructure deeper into the global economy and creating persistent, long-term demand for the entire ecosystem, with Bitcoin as its principal reserve asset.
III. The Digital Gold Rush: Analyzing Institutional Adoption and Supply Dynamics
The favorable macro-fundamental tailwinds are translating into a direct and measurable impact on Bitcoin’s market structure. This is most evident in the quantifiable demand from new institutional players and the concurrent, sharp reduction in the available liquid supply.
3.1 The ETF Effect: A Paradigm Shift in Demand
The introduction and immense success of spot Bitcoin ETFs have fundamentally re-engineered the market’s demand side. These investment vehicles provide a regulated, accessible, and operationally simple way for a vast new pool of investors to gain exposure to Bitcoin without the technical complexities of self-custody or navigating crypto exchanges.23 The result has been an unprecedented wave of capital inflows.
Recent data shows staggering demand, with reports of $1.2 billion flowing into spot ETFs in a single day and over $3.2 billion in one week.3 On an ongoing basis, these products are attracting an average of approximately $518 million in daily net inflows.24 Projections based on this trend estimate that a total of ~$120 billion in institutional funds could flow into Bitcoin by the end of 2025.25 This demand is not speculative “hot money” but rather represents a structural, long-term reallocation of capital. The buyers are often large asset managers like BlackRock, building diversified portfolios for clients with long time horizons.23 This creates a programmatic and relatively price-inelastic source of demand; the ETFs must continue to purchase Bitcoin to meet client inflows, establishing a persistent and powerful bid in the market that was absent in previous market cycles.
3.2 Corporate and Sovereign Adoption
The trend of utilizing Bitcoin as a strategic treasury reserve asset is expanding beyond early corporate adopters and is now reaching the sovereign level. As of the third quarter of 2025, 176 public and private companies have allocated a portion of their balance sheets to Bitcoin, collectively holding over one million BTC.24 This strategy serves as a crucial hedge against inflation and fiat currency debasement for corporate treasuries.
Lending immense legitimacy to this approach, the U.S. government has signaled a formal shift in its own strategy. In March 2025, the administration established a Strategic Bitcoin Reserve, moving to formally recognize the asset’s role and transitioning it from a seized asset to a strategic one.2 This action creates a powerful game-theoretic dynamic on the global stage. As more corporations and nation-states add a finite asset like Bitcoin to their balance sheets, the perceived career and portfolio risk for those who have not adopted it increases. The fear of being left behind in a world where competitors and governments are accumulating a scarce monetary good will likely compel others to follow suit, creating a self-reinforcing cycle of adoption and price appreciation.
3.3 On-Chain Analysis: The Imminent Supply Squeeze
While institutional demand is exploding, the readily available supply of Bitcoin is simultaneously contracting at a historic rate. On-chain data reveals that the amount of Bitcoin held on centralized exchanges has plummeted to its lowest level in six years.3 This is a powerful indicator of market sentiment, showing that existing investors are moving their coins into long-term cold storage rather than keeping them on exchanges in preparation to sell. This behavior, known as “HODLing,” reflects a strong conviction in Bitcoin’s future price potential.
Exchange reserves represent the market’s liquid, floating supply. When this inventory dwindles, the market becomes exceptionally tight. The current situation is a textbook supply squeeze in real-time. On one side, there is an unprecedented, programmatic, and persistent demand shock from ETFs. On the other side, there is a rapidly contracting liquid supply as long-term holders withdraw their assets from the market. The collision of these two powerful forces is the primary mechanical driver of the current bull market. New buyers must bid prices up with increasing aggression to convince the diminishing pool of sellers to part with their coins, creating the potential for explosive, parabolic price movements.
IV. Gauging the Market’s Psyche: A Deep Dive into Sentiment
While fundamentals and supply-demand dynamics provide the “why” for the current rally, sentiment analysis reveals “who” is driving it and whether the trend is sustainable or built on speculative froth.
4.1 The Fear & Greed Index Deconstructed
The Crypto Fear & Greed Index provides a quantitative snapshot of market emotion by aggregating data from multiple sources, including volatility, market volume, social media chatter, and search trends.26 The index is scored on a scale from 0 (Extreme Fear) to 100 (Extreme Greed). As of the latest reading, the index is at a Neutral level of 58.5 This reading has shown a gradual increase from 55 yesterday and 51 last week, indicating growing optimism but a notable absence of widespread euphoria.6
The significance of this neutral reading cannot be overstated, as it is occurring while Bitcoin is trading at or near its all-time high price. Historically, major market tops are characterized by extreme levels of greed and euphoria, with index values typically pushing above 75 as retail investors, driven by a Fear Of Missing Out (FOMO), pile into the market.29 The current tempered sentiment suggests that the ongoing rally is not being driven by a speculative retail mania but rather by the more measured, conviction-based buying from institutional participants.
This presents a powerful contrarian case for further upside. The fact that the market has reached record prices without succumbing to widespread greed indicates that the proverbial “wall of worry” remains intact. It suggests that the phase of mass public participation and speculative excess, which typically marks the final stage of a bull market, has not yet begun. This implies that the current trend has significant room to run before it becomes dangerously overheated and vulnerable to a major correction. The “smart money” has established its position, but the “dumb money” has yet to fully arrive, leaving substantial fuel for the next leg of the rally.5
V. Price Action and Technical Outlook
Technical analysis of the Bitcoin price chart confirms that the market structure is aligned with the bullish fundamental and sentimental backdrop, providing a clear framework for timing and risk management.
5.1 Chart Analysis: Breakout, Retest, and Consolidation
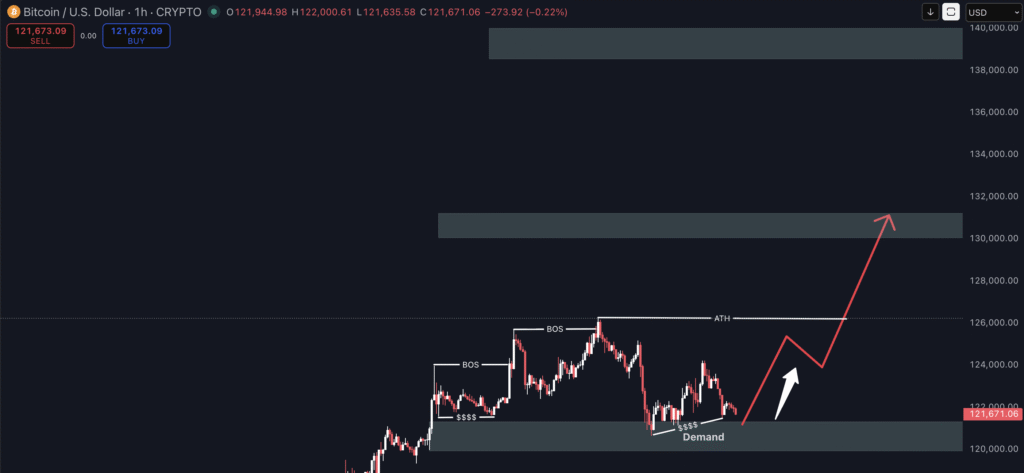
Recent price action has been constructively bullish. Bitcoin successfully broke through its previous all-time high, establishing a new peak near $126,198.8 Following this impulsive move, the price entered a period of consolidation, experiencing a healthy and orderly pullback. It is currently trading in a range between approximately $122,000 and $124,000.3
This pattern is a classic example of bullish trend continuation. The market has successfully tested the former resistance level around $120,000 and is now treating it as a new, solid floor of support.7 This price action demonstrates that profit-taking from short-term traders is being effectively absorbed by new buyers who are confident enough to enter the market at these elevated levels. Market analysts widely view this behavior not as a sign of a trend reversal, but as a “healthy short-term correction” that builds a stable base for the next move higher.7
5.2 Indicator Analysis: Confirming Bullish Momentum
A suite of technical indicators provides objective confirmation of the underlying strength of the current uptrend. The Moving Average Convergence Divergence (MACD) indicator shows the MACD line remaining firmly above its signal line, a standard confirmation of positive momentum.8 The Relative Strength Index (RSI) is hovering near 70; while this level can sometimes indicate overbought conditions, in the context of a strong breakout, it primarily serves to confirm the powerful positive momentum driving the trend.8
Perhaps the most significant long-term signal is the formation of a “golden cross.” This occurs when the shorter-term 50-day Exponential Moving Average (EMA) crosses above the longer-term 200-day EMA. This classic bullish pattern is widely followed by trend-following funds and institutional algorithms, signaling that the long-term trend has definitively shifted to the upside and adding further technical weight to the bullish thesis.8
5.3 Identification of Critical Levels
Based on the recent price action and analyst commentary, several key price levels have been established that will be critical for trade planning.
- Support Zones: The most critical immediate support level is $120,000. This psychological and technical level represents the line in the sand for the current bullish structure.7 A sustained break below this area would be a significant technical warning. Deeper support can be found in the range of $115,000 to $117,000.3
- Resistance/Target Zones: Immediate resistance is located in the profit-taking zone between $126,500 and $127,000.8 A decisive breakout above this ceiling would signal the start of the next leg up, with initial targets at the psychological and technical resistance cluster of $129,000 to $130,000.7 Beyond that, analyst consensus points toward medium-term targets in the $140,000 to $150,000 region.3
The following table summarizes these critical levels for quick reference.
| Level Type | Price (USD) | Significance & Source |
| Primary Target | $140,000 | Medium-term projection based on analyst consensus 4 |
| Initial Target | $129,000 – $130,000 | Next major resistance zone after clearing ATH 7 |
| Immediate Resistance | $126,500 – $127,000 | Current consolidation ceiling and profit-taking area 8 |
| Current Price Range | $122,000 – $124,000 | Consolidation zone post-ATH breakout 3 |
| Critical Support | $120,000 | Key psychological and technical floor; invalidation level 7 |
| Secondary Support | $115,000 – $117,000 | Fallback support zone if $120k fails 3 |
VI. Following the Smart Money: Commitment of Traders (COT) Report Analysis
Analysis of the Commitment of Traders (COT) report for futures markets provides a valuable lens into the positioning of sophisticated market participants, offering another layer of confirmation for the prevailing market trend.
6.1 Understanding the Players
The COT report, published weekly by the CFTC, disaggregates the open interest in futures contracts into distinct trader categories.30 For financial products like Bitcoin futures, the key groups are: Dealer/Intermediary (market makers who are typically delta-neutral), Asset Manager/Institutional (pension funds, endowments, and ETF issuers who often represent long-term institutional conviction), and Leveraged Funds (hedge funds and Commodity Trading Advisors who are typically more speculative and trend-following).30 The remaining “Non-reportable” positions generally represent smaller retail traders.
6.2 Interpreting Likely Positioning
While a specific data table for the most recent COT report is not provided, the prevailing market narrative allows for a highly confident inference of the positioning among these key groups. The massive and sustained inflows into spot Bitcoin ETFs strongly suggest that the Asset Manager category is heavily net long. These institutions use the futures market to gain exposure and hedge their ETF-related spot positions. Their long stance reflects a deep, fundamental conviction in the asset.
Concurrently, the powerful and clear uptrend confirmed by technical analysis indicates that Leveraged Funds are also almost certainly net long. As trend-followers, these funds are designed to capitalize on strong market momentum. The rising prices and positive media coverage also suggest that smaller retail traders (Non-reportables) are becoming increasingly net long.
This market environment likely reflects a rare and powerful alignment of interests across all major participant categories. The trend is being initiated and anchored by the long-term conviction of institutional Asset Managers. It is being amplified by the momentum-chasing capital of Leveraged Funds. This is a crucial distinction from purely retail-driven speculative bubbles. A trend led by institutional capital is inherently more sustainable and robust. The alignment of both long-term conviction money and short-term momentum money creates a formidable buying force that is difficult and costly to bet against.
VII. Synthesis and Actionable Trading Signal
The decision to take a position in any market should be based on a confluence of evidence, not a single data point. The current Bitcoin market presents a rare and powerful alignment across all four pillars of analysis, forming a cohesive and compelling bullish thesis.
- FUNDAMENTAL (The Why): The macroeconomic environment of central bank easing, persistent inflation above target, and a weakening U.S. dollar creates the ideal conditions for a non-sovereign, scarce store of value to thrive. This is reinforced by a major regulatory de-risking in the United States, which has unlocked the door for institutional capital.
- SUPPLY/DEMAND (The What): An unprecedented institutional demand shock, driven by the success of spot ETFs, is colliding head-on with a historic supply squeeze, as evidenced by six-year lows in exchange reserves. This fundamental imbalance creates intense and persistent upward pressure on price.
- SENTIMENTAL (The Who): The market is optimistic but has not yet reached a state of dangerous euphoria. The current “Neutral” sentiment reading indicates that the rally is being led by institutional conviction, with the phase of widespread retail FOMO likely still to come. This suggests the trend has both strength and sustainability.
- TECHNICAL (The When): The price chart has provided a clear signal of trend continuation. The breakout to a new all-time high, followed by a successful test of support and healthy consolidation, offers an objective and favorable technical basis for initiating a long position.
Primary Trading Signal
Based on this comprehensive, multi-factor analysis, the signal is unequivocal: INITIATE A LONG POSITION IN BITCOIN (BTC/USD).
Trade Rationale Summary
The recommendation is to buy into a structurally strong, institutionally-led bull market that is being propelled by powerful macroeconomic tailwinds. The current consolidation phase above the critical $120,000 support level presents a favorable risk-to-reward opportunity to join this established uptrend before a potential next major leg higher. The absence of “Extreme Greed” in the market sentiment adds a layer of confidence that this trend has sustainability and significant further upside potential.
VIII. Risk Management and Trade Execution Parameters
A sound analysis must be paired with a disciplined execution and risk management plan. This section provides a clear framework for implementing the trading signal.
Defining Risk
The primary risks that would invalidate the bullish thesis include: a sudden and unexpected hawkish pivot from the Federal Reserve (i.e., signaling rate hikes); a significant negative regulatory development, such as the failure of the CLARITY Act in the Senate or the introduction of punitive legislation; or a systemic “black swan” event that triggers a market-wide deleveraging and a flight to the safety of cash. From a technical perspective, a sustained daily close below the $120,000 support level would break the current bullish market structure and warrant an immediate exit from long positions.
Strategic Entry, Stop-Loss, and Profit Targets
A disciplined approach to trade entry and management is crucial for success.
- Strategic Entry: Entry is recommended on pullbacks into the lower half of the current consolidation range to optimize the risk/reward ratio. An ideal entry zone is between $120,500 and $122,500.
- Defensive Positioning: A stop-loss order should be placed at $118,800. This level is strategically positioned below the critical $120,000 psychological support and the recent consolidation lows, providing a buffer against minor volatility while ensuring an exit if the bullish market structure is definitively broken.
- Profit Targets: A multi-tiered profit-taking strategy is advised to manage the position proactively.
- Take-Profit 1: $129,500. This level is just below the $130,000 psychological resistance. Selling one-third of the position here allows a trader to de-risk the trade by locking in initial profits.
- Take-Profit 2: $139,000. This target approaches the medium-term analyst consensus target of $140,000. Selling another third of the position here secures a substantial gain.
- Take-Profit 3: Open. The final third of the position should be left to run, with the stop-loss trailed upwards (e.g., to the entry price, then to TP1) to capture any further, potentially parabolic, upside while protecting profits.
The following table provides a clear, at-a-glance summary of the actionable trade parameters.
| Parameter | Action / Level (USD) | Rationale |
| Signal | BUY / LONG | Confluence of bullish fundamental, sentimental, and technical factors. |
| Asset | Bitcoin (BTC/USD) | |
| Entry Zone | $120,500 – $122,500 | Entry on a pullback to the key support zone for optimal risk/reward. |
| Stop-Loss | $118,800 | Placed below the critical $120k support to invalidate the trade on a structural break. |
| Take-Profit 1 | $129,500 | De-risk the position at the first major resistance target. |
| Take-Profit 2 | $139,000 | Secure further profits at the next major analyst target level. |
| Take-Profit 3 | Open / Trailing Stop | Allow the remainder to capture further upside in a strong trend. |
| Position Sizing | Based on individual risk tolerance (e.g., risk 1-2% of portfolio capital). | Standard professional risk management practice. |
Works cited
- All eyes on FOMC Meeting minutes releasing today, accessed on October 9, 2025, https://www.financialexpress.com/business/investing-abroad-all-eyes-on-federal-open-market-committee-meeting-minutes-releasing-today-4001939/
- Fact Sheet: President Donald J. Trump Signs GENIUS Act into Law – The White House, accessed on October 9, 2025, https://www.whitehouse.gov/fact-sheets/2025/07/fact-sheet-president-donald-j-trump-signs-genius-act-into-law/
- Bitcoin dips after hitting record $125K; Ethereum, altcoins tumble, accessed on October 9, 2025, https://m.economictimes.com/markets/cryptocurrency/bitcoin-dips-after-hitting-record-125k-ethereum-altcoins-tumble/articleshow/124332094.cms
- Bitcoin hits all-time high. Can the rally last?, accessed on October 9, 2025, https://www.indiatoday.in/business/story/bitcoin-hits-all-time-high-can-the-rally-last-btc-prices-cryptocurrency-market-crypto-prices-2798416-2025-10-06
- Crypto Fear & Greed Index | Bitcoin Sentiment – Binance, accessed on October 9, 2025, https://www.binance.com/en/square/fear-and-greed-index
- CMC Crypto Fear and Greed Index – CoinMarketCap, accessed on October 9, 2025, https://coinmarketcap.com/charts/fear-and-greed-index/
- Bitcoin eases to $121K, Ethereum and altcoins also witness decline, accessed on October 9, 2025, https://m.economictimes.com/markets/cryptocurrency/crypto-news/bitcoin-eases-to-121k-ethereum-and-altcoins-also-witness-decline/articleshow/124381029.cms
- Bitcoin trades nears $124K; BNB soars past $1,200 to hit fresh all-time high, accessed on October 9, 2025, https://m.economictimes.com/markets/cryptocurrency/crypto-news/bitcoin-trades-nears-124k-bnb-soars-past-1200-to-hit-fresh-all-time-high/articleshow/124354988.cms
- Effective Federal Funds Rate – FEDERAL RESERVE BANK of NEW YORK, accessed on October 9, 2025, https://www.newyorkfed.org/markets/reference-rates/effr
- H.15 – Selected Interest Rates (Daily) – October 08, 2025 – Federal Reserve Board, accessed on October 9, 2025, https://www.federalreserve.gov/releases/h15/
- The Employment Situation – August 2025 – Bureau of Labor Statistics, accessed on October 9, 2025, https://www.bls.gov/news.release/pdf/empsit.pdf
- US Unemployment Rate (Monthly) – United States – Historical… – YCharts, accessed on October 9, 2025, https://ycharts.com/indicators/us_unemployment_rate
- Unemployment Rate (UNRATE) | FRED | St. Louis Fed, accessed on October 9, 2025, https://fred.stlouisfed.org/series/UNRATE
- ycharts.com, accessed on October 9, 2025, https://ycharts.com/indicators/us_inflation_rate#:~:text=US%20Inflation%20Rate%20is%20at,long%20term%20average%20of%203.28%25.
- What is the current inflation rate in the US? – USAFacts, accessed on October 9, 2025, https://usafacts.org/answers/what-is-the-current-inflation-rate/country/united-states/
- Current U.S. Inflation Rate is 2.9%: Why It Matters – NerdWallet, accessed on October 9, 2025, https://www.nerdwallet.com/article/investing/inflation
- Bitcoin hits record high of $125,689, days after surpassing Amazon to become the world’s seventh most valuable asset, accessed on October 9, 2025, https://m.economictimes.com/news/international/us/bitcoin-hits-record-high-of-125689-days-after-surpassing-amazon-to-become-the-worlds-seventh-most-valuable-asset/articleshow/124317185.cms
- Crypto Regulation in the U.S.: Summer 2025 Legislative Milestones and What Comes Next, accessed on October 9, 2025, https://caldwelllaw.com/news/crypto-regulation-us-summer-2025-legislation/
- GENIUS & CLARITY Acts Reshape U.S. Crypto Regulation – The National Law Review, accessed on October 9, 2025, https://natlawreview.com/article/update-2025-us-stablecoin-legislation
- Crypto Week 2025: From uncertainty to regulation in the U.S. digital asset space – Ocorian, accessed on October 9, 2025, https://www.ocorian.com/knowledge-hub/insights/crypto-week-2025-uncertainty-regulation-us-digital-asset-space
- State Regulators Increase Regulations of Crypto Exchanges Despite Industry Pushback | Insights & Resources | Goodwin, accessed on October 9, 2025, https://www.goodwinlaw.com/en/insights/blogs/2025/09/state-regulators-increase-regulations-of-crypto-exchanges-despite-industry-pushback
- Institutional investors getting more comfortable with cryptocurrencies: report, accessed on October 9, 2025, https://www.benefitscanada.com/canadian-investment-review/alts/institutional-investors-getting-more-comfortable-with-cryptocurrencies-report/
- iShares Bitcoin Trust (IBIT) | Spot Bitcoin ETP – BlackRock, accessed on October 9, 2025, https://www.blackrock.com/us/financial-professionals/investments/products/bitcoin-investing
- Crypto Q4 2025 Outlook – Equiti, accessed on October 9, 2025, https://www.equiti.com/sc-en/news/global-macro-analysis/crypto-q4-2025-outlook/
- Forecasting Institutional Flows to Bitcoin in 2025/2026 – AWS, accessed on October 9, 2025, https://prowly-prod.s3.eu-west-1.amazonaws.com/uploads/mailing_attachments/80962/167b46599bd0254b1ae2dfe4ad2af0a9.pdf
- Crypto Trading 101 | What Is Market Sentiment? – Cryptohopper, accessed on October 9, 2025, https://www.cryptohopper.com/blog/what-is-crypto-market-sentiment-and-why-does-it-matter-4198
- Crypto Fear and Greed Index: Live Market Sentiment | Delta by eToro, accessed on October 9, 2025, https://delta.app/en/fear-greed-index
- Bitcoin Fear and Greed Index [Live & History Chart], accessed on October 9, 2025, https://charts.bitbo.io/fear-greed/
- Crypto Fear and Greed Index – Bitcoin Momentum Tracker – Cointree, accessed on October 9, 2025, https://www.cointree.com/learn/crypto-fear-and-greed-index/
- Understanding the COT Report: Features, Types, and Usage Explained – Investopedia, accessed on October 9, 2025, https://www.investopedia.com/terms/c/cot.asp
- Commitment of Traders – CME Group, accessed on October 9, 2025, https://www.cmegroup.com/tools-information/quikstrike/commitment-of-traders.html
Leave a Reply