I. Executive Summary: Rationale for a Conditional SELL
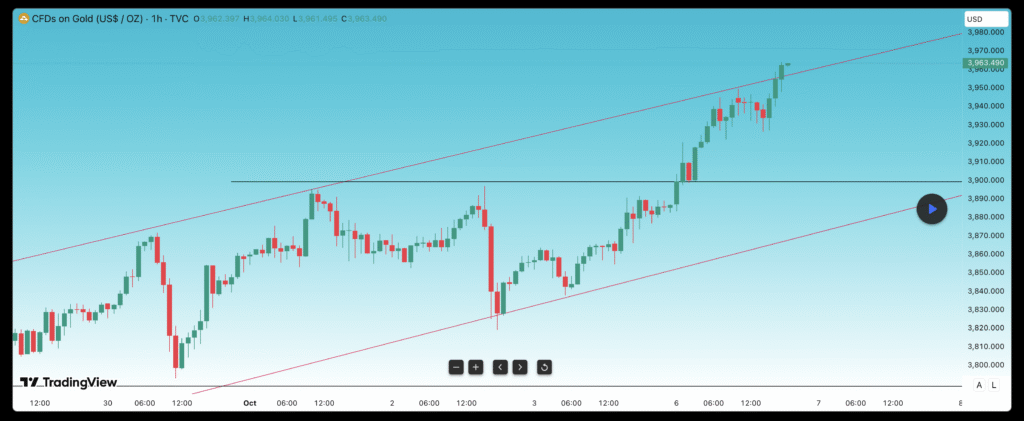
This report analyzes the XAU/USD (Gold Spot) hourly (H1) chart, which indicates the completion of a major bullish impulse wave. The analysis identifies key technical signs of momentum exhaustion at the current high price, making the market highly vulnerable to an immediate corrective pullback driven by profit-taking.
The resulting signal is a high-precision, short-term Conditional SELL. This is a tactical counter-trend strategy and requires rigorous risk management, as the long-term fundamental outlook for gold remains strongly bullish. The purpose of this short trade is to capture the quick downward move before the main uptrend resumes.
1.1. Actionable Signal: CONDITIONAL SELL (Correction/Profit-Taking)
The trade is strictly conditional upon confirmation of price rejection at the immediate resistance zone, signaling that short-term supply has temporarily overpowered demand.
| Parameter | Condition / Value (Approximate) | Primary Rationale for SELL |
| Trade Type | Conditional SELL (Counter-Trend) | Targeting a necessary corrective pullback after a prolonged, aggressive move where buying momentum is fading. |
| Entry Zone | $3,955.00 – $3,965.00 | Waiting for price rejection at this immediate high/supply concentration zone.1 |
| Confirmation | Mandatory: H1 candle close forming a confirmed bearish reversal pattern (e.g., Shooting Star, Bearish Engulfing) in the Entry Zone. | Confirms supply has re-entered the market and short-term control has shifted to sellers. |
| Stop-Loss (SL) | Above the recent swing high/resistance (e.g., $3,975.00 approx.) | Invalidation point: a close above this level confirms continued bullish expansion, immediately invalidating the SELL thesis.2 |
| Target 1 (T1) | $3,925.00 | Initial take-profit zone, targeting the immediate structural low/consolidation support. |
| Target 2 (T2) | $3,900.00 | Deeper retracement targeting the previous major resistance zone (now minor support). |
II. Technical Justification: Why the SELL is Warranted
The decision to initiate a SELL signal is based on the convergence of three critical technical indicators confirming that the recent upward momentum has stalled.
2.1. Primary Driver: MACD Momentum Exhaustion
This is the most compelling reason for the SELL signal. Despite the price reaching a new high, the MACD Histogram indicates that the conviction behind the rally is dissipating.
- Histogram Contraction: The MACD Histogram bars, which are green (bullish), are visibly contracting (shrinking in height) on the chart.
- Implication: Histogram contraction is a leading sign that momentum—the speed and strength of the buying pressure—is decelerating, even if the price is still inching up.3 This warns that the current impulse wave has culminated and the market is highly susceptible to a sharp, responsive drop.5
2.2. Price Extension and Overheated Conditions
The price action itself suggests the rally is overextended, inviting a correction:
- Aggressive Impulse: The market has moved with great velocity and minimal pullbacks over the past few sessions. This aggressive price expansion creates “overheated” conditions, where the market is considered structurally overbought on the short-term timeframe.
- Profit-Taking Incentive: Large institutional buyers who drove the price from the $3,800 lows will now look to monetize their gains, creating natural downward pressure (supply) near the $3,950–$3,960 resistance zone. This expected profit-taking is the direct catalyst for the short trade.
2.3. Mandatory Price Action Confirmation
Since this is a counter-trend trade, relying only on momentum is insufficient. The trade requires hard confirmation from the price action itself:
- Bearish Reversal Pattern: Entry is delayed until the H1 chart closes a definite bearish reversal candlestick pattern (e.g., a high-wicked Shooting Star or a Bearish Engulfing pattern) at the current high.6 This ensures that the anticipated supply has actually materialized and overpowered the remaining buyers, reducing the probability of a false signal.
III. Fundamental Context: Framing the Correction
While the technical analysis supports a short-term SELL, the decision must be understood within the context of gold’s long-term, structurally bullish fundamentals.
3.1. Long-Term Bullish Integrity (Why the Correction is Temporary)
The primary trend drivers for gold remain intact and powerful, meaning the SELL trade is purely correctional and not a trend reversal:
- Monetary Policy Support: The Federal Reserve is actively engaged in a rate-cutting cycle (begun in September 2025), which reduces the opportunity cost of holding non-yielding gold.
- Structural Demand: Strong, consistent buying by central banks (topping 1,000 tonnes for the third consecutive year) provides a robust floor for prices.
- Price Forecasts: Analysts project prices to continue their march toward the $4,000 per ounce milestone by mid-2026.
3.2. Strategic Conclusion
The short-term SELL signal is a tactical response to market mechanics—the need for a structural price reset. It targets the volatility created by profit-taking due to “overheated prices,” but this movement is expected to be contained, after which the overwhelming fundamental factors will push the price higher again.
IV. Risk Assessment and Mitigation
Due to the nature of trading against the dominant trend, the risk profile of this trade is elevated.
4.1. Counter-Trend Risk and SL Placement
- Risk: The primary danger is that the strong underlying bullish trend could simply absorb the selling pressure and drive the price immediately toward the next major psychological level ($4,000) without a significant pullback.
- Mitigation: The Stop-Loss must be strictly adhered to at $3,975.00. This level is the non-negotiable point of invalidation. If the price closes above this high, it confirms the continuation of the impulse wave, and the SELL thesis is wrong.2
4.2. Execution and Protection
| Risk Category | Description of Risk | Likelihood | Impact | Mitigation Plan/Action |
| Technical Failure | Failed bearish reversal signal (False Signal) leading to immediate upward continuation. | MEDIUM | HIGH | Strictly wait for the H1 confirmation candle to close. If SL is hit, exit immediately.2 |
| Whipsaw Volatility | Price briefly moves above the SL before reversing (Stop Hunting). | MEDIUM | MEDIUM | Position sizing should be conservative due to the counter-trend nature. Move SL to breakeven quickly once T1 is reached to protect capital. |
| Fundamental Shift | Unexpected news (e.g., geopolitical crisis) drives aggressive, immediate buying. | LOW | HIGH | Rely on the defined Stop-Loss as the ultimate defense against market shocks. |
Works cited
- accessed on September 30, 2025, https://www.investopedia.com/trading/support-and-resistance-basics/#:~:text=Support%20occurs%20at%20the%20point,using%20trendlines%20and%20moving%20averages.
- FY-2023-Risk-Analysis-Template.docx – State Department, accessed on September 30, 2025, https://www.state.gov/wp-content/uploads/2023/01/FY-2023-Risk-Analysis-Template.docx
- When To Use And How To Read The MACD Indicator – Commodity.com, accessed on September 30, 2025, https://commodity.com/technical-analysis/macd/
- MACD Histogram – Knowledge base – cTrader Help Centre, accessed on September 30, 2025, https://help.ctrader.com/knowledge-base/indicators/oscillators/macd-histogram/
- What Is MACD? – Investopedia, accessed on September 30, 2025, https://www.investopedia.com/terms/m/macd.asp
- MACD Histogram: Master Price Momentum Trading with This Powerful Technical Tool, accessed on September 30, 2025, https://tradefundrr.com/moving-average-convergence-divergence-macd-histogram/
Leave a Reply