I. Executive Summary and Actionable Signal
This report evaluates the XAU/USD (Gold Spot) hourly (H1) chart following a successful defense of a key demand zone, resulting in a strong rally. The technical structure confirms the resumption of the primary bullish trend, which is profoundly supported by long-term fundamental drivers. The analysis generates a high-conviction continuation signal targeting a breakout to new highs.
1.1. Actionable Signal: BUY (Continuation/Breakout)
The current market posture dictates a BUY signal, focused on exploiting the market’s renewed bullish momentum to break above the recent resistance level. The deep pullback witnessed previously has been absorbed, confirming the structural integrity of the uptrend.
| Parameter | Condition / Value (Approximate) | Rationale |
| Trade Type | BUY (Breakout Continuation) | The market has successfully defended support and momentum has turned bullish, favoring a move to new highs. |
| Entry Price | Above the consolidation high (e.g., $3,887.00 breakout) | Confirms that supply at the previous swing high has been fully overcome, validating immediate follow-through. |
| Stop-Loss (SL) | Below the immediate consolidation support (e.g., $3,860.00 approx.) | Defines the risk based on the structural low of the current bullish consolidation phase. |
| Target 1 (T1) | $3,950.00 | Initial projection based on structural extension, confirming successful breakout. |
| Long-Term Target | $4,000.00 + | Aligned with fundamental forecasts for mid-2026. |
II. Technical Analysis: Momentum and Structure Confirmation
The updated H1 chart provides clear evidence that the correctional phase has ended and the primary uptrend has resumed.
2.1. Price Action and Structural Integrity
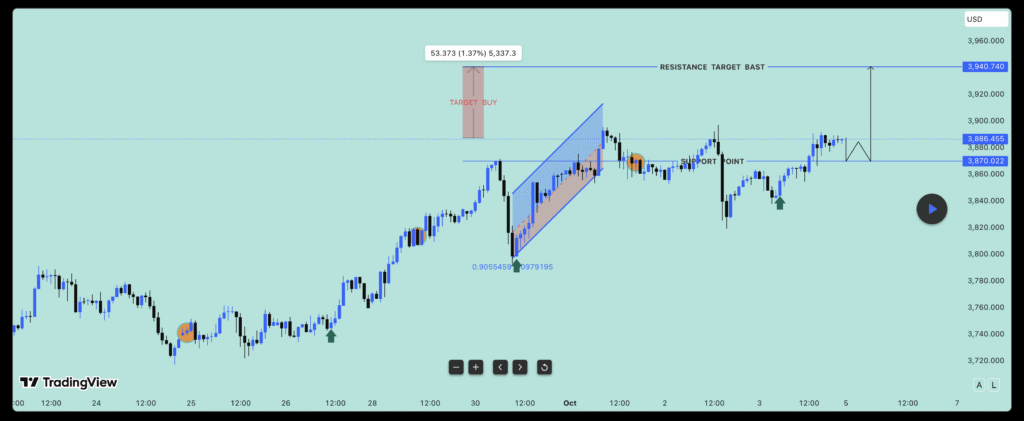
- Successful Rejection: The price has decisively rallied from the recent swing low (around $3,830), demonstrating that institutional demand successfully defended the critical support zone. This confirms that the prior move was indeed a pullback and not a reversal.1
- Current Structure: The price is now forming a tighter consolidation pattern just below the recent swing high (near $3,900). This pattern, located at the top of a rally, is frequently a precursor to a breakout, signaling that buyers are accumulating positions before the next impulse wave.
- Targeted Resistance: The recent high, approximately $3,900, is the immediate technical resistance.2 A confirmed close above this level is required to validate the continuation signal and open the path to higher targets.
2.2. MACD Momentum Confirmation
The Moving Average Convergence Divergence (MACD) indicator provides strong, quantifiable validation of the returning bullish momentum:
- Bullish Crossover in Bullish Territory: The MACD line (fast momentum) has crossed above the Signal line (slow momentum). Crucially, this crossover is occurring above the zero line, which indicates that the underlying trend remains significantly positive (12-period EMA is higher than the 26-period EMA). This confluence of signals generates a high-conviction bullish entry point.3
- Expanding Momentum: The MACD Histogram bars are now green and visibly expanding.4 The increasing height of the green bars directly translates to
accelerating bullish momentum.6 This visual confirmation suggests strong conviction behind the recent rally and minimizes the risk of a false breakout near the $3,900 resistance.
2.3. Layered Confirmation Strategy
To maximize reliability, the entry strategy relies on layered confirmation: the strong MACD signal is combined with a price breakout entry. This use of momentum (MACD) and price action (breakout) together enhances accuracy and mitigates risks associated with single indicators.6 Entering above the current consolidation high ensures that the trade is only activated once the existing supply is overcome and the price is committed to the next bullish phase.1
III. Fundamental Analysis: Structural Drivers for Continued Strength
The bullish technical signal is robustly supported by a long-term structural bull case for gold, driven by key global economic and political factors.
3.1. Favorable Monetary Policy Environment
- Fed Rate Cuts: The Federal Reserve initiated a cycle of interest rate reductions in September 2025, bringing the federal funds rate into the 4.00%–4.25% range. J.P. Morgan Global Research anticipates further cuts in 2025 and 2026.
- Impact on Gold: Expected loosening of monetary policy lowers the yield on interest-bearing assets like U.S. Treasury bonds. This reduced opportunity cost makes non-yielding gold increasingly attractive to institutional investors, serving as a primary structural driver for its current price trajectory.
3.2. Geopolitical and Economic Haven Demand
- Haven Status: Gold continues to perform its traditional role as a safe haven and store of value amidst global uncertainty. Rising geopolitical tensions, fears of a global economic slowdown, and trade uncertainty are driving investors to move capital out of riskier assets and into gold.
- Central Bank Buying: Central banks globally have maintained robust demand, with buying topping 1,000 tonnes for the third consecutive year in 2025. This strong institutional appetite provides a reliable floor and significant structural support for XAU/USD prices.
3.3. Price Forecasts
Fundamental forecasts align with the technical expectation of continued upward movement:
- Near-Term Targets: The outlook for Q4 2025 remains bullish, with analysts widely targeting the $4,000 per ounce milestone.
- Long-Term Projection: J.P. Morgan Research anticipates prices to average $3,675/oz by the final quarter of 2025 and to climb toward $4,000/oz by mid-2026.
IV. Execution Plan and Risk Mitigation
4.1. Execution Strategy Summary
The trade is executed as a breakout continuation to capture the renewed bullish momentum confirmed by the MACD.
- Entry: Wait for a confirmed breach above the $3,887.00 consolidation level using a Stop Buy Entry Order.1
- Stop-Loss: Place the SL at $3,860.00, slightly below the recent structural low. This point defines the maximum acceptable risk and confirms trade invalidation if the current short-term rally fails.3
- Profit Management: Secure partial profit at T1 ($3,950.00) and move the Stop-Loss to breakeven to protect capital while allowing the remainder of the position to target $4,000.00+.
4.2. Risk Assessment and Mitigation
The primary risk is a false breakout at the $3,900 resistance level.
| Risk Category | Description of Risk | Likelihood | Impact | Mitigation Plan/Action |
| Technical Failure | False breakout at $3,900 resistance, leading to immediate reversal. | MEDIUM | HIGH | Strict adherence to the $3,860.00 Stop-Loss. Re-evaluation of the price structure if SL is hit.8 |
| Momentum Stalling | Price consolidation instead of immediate follow-through after entry. | MEDIUM | MEDIUM | Utilize a tight Stop Buy Entry Order to confirm immediate momentum; move SL to breakeven if the trade stalls near the entry price.1 |
| Fundamental Shift | Unexpected change in Fed policy (e.g., hawkish reversal) reducing haven demand. | LOW | HIGH | Acknowledge fundamental risks; maintain disciplined risk management by using the defined Stop-Loss as the final defense.8 |
Works cited
- Pullback: What It Means in Trading, With Examples – Investopedia, accessed on September 30, 2025, https://www.investopedia.com/terms/p/pullback.asp
- accessed on September 30, 2025, https://www.investopedia.com/trading/support-and-resistance-basics/#:~:text=Support%20occurs%20at%20the%20point,using%20trendlines%20and%20moving%20averages.
- MACD Indicator Explained: Complete Guide to MACD Line, Signal Line, Histogram, Crossover, Zero Line – Mind Math Money, accessed on September 30, 2025, https://www.mindmathmoney.com/articles/understanding-the-macd-indicator-macd-line-signal-line-histogram-crossover-and-zero-line
- MACD Histogram – Knowledge base – cTrader Help Centre, accessed on September 30, 2025, https://help.ctrader.com/knowledge-base/indicators/oscillators/macd-histogram/
- MACD Histogram: Master Price Momentum Trading with This Powerful Technical Tool, accessed on September 30, 2025, https://tradefundrr.com/moving-average-convergence-divergence-macd-histogram/
- How to Use the MACD Indicator for Profitable Trades, accessed on September 30, 2025, https://highstrike.com/macd-trading-strategy/
- MACD and RSI Strategy: 73% Win Rate – Rules, Settings – QuantifiedStrategies.com, accessed on September 30, 2025, https://www.quantifiedstrategies.com/macd-and-rsi-strategy/
- FY-2023-Risk-Analysis-Template.docx – State Department, accessed on September 30, 2025, https://www.state.gov/wp-content/uploads/2023/01/FY-2023-Risk-Analysis-Template.docx
Leave a Reply