Expert-Level XAUUSD (Gold/USD) Strategic Analysis and Trading Signal Report (H1 Timeframe)
I. Executive Summary: High-Conviction Trading Signal
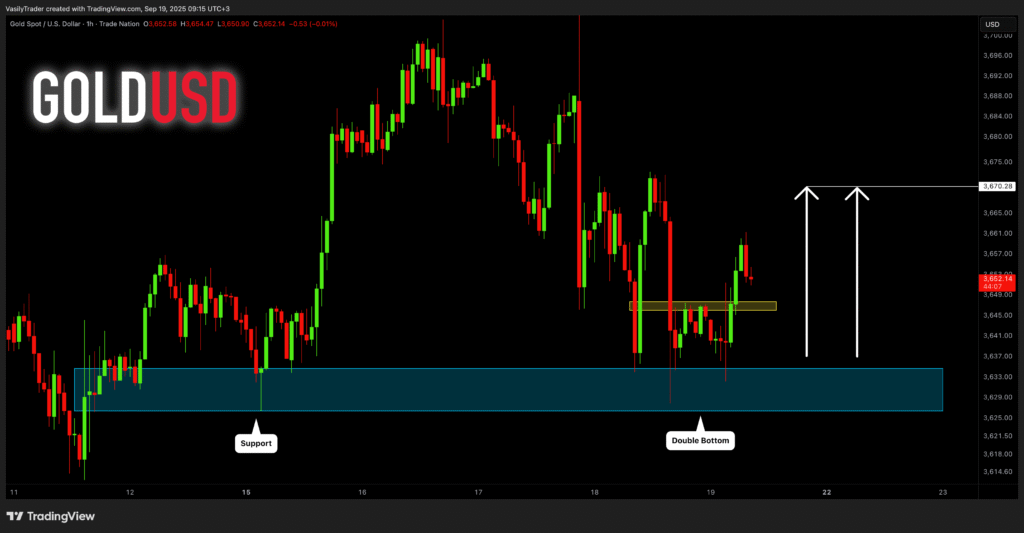
This analysis provides a strategic assessment of the Gold Spot/U.S. Dollar (XAUUSD) pair, focusing on the 1-hour (H1) technical structure within the broader context of prevailing macroeconomic drivers. The market is currently exhibiting a sharp, but routine, technical pullback following a significant rally that established a new all-time high (ATH) near $3,790.82.1 This retracement is viewed as a necessary consolidation to digest recent gains and neutralize short-term momentum extremes, confirming a high-conviction
“Buy the Dip” opportunity.
The underlying structural trend remains robustly bullish, supported by persistent fundamental tailwinds such as expected Federal Reserve rate easing and elevated global inflation fears.3 The current price action, pulling back toward the $3,760 zone, has successfully brought key oscillators like the Relative Strength Index (RSI) down to the neutral 50 level 5, providing optimal technical positioning for the continuation of the uptrend toward the $3,800 psychological barrier.
1.1 Actionable Signal Matrix: XAUUSD (H1/Short-Term)
The signal is predicated on entering the market as the price retests a high-confluence support zone, which aligns with prior structural resistance levels that have successfully been breached and are now expected to act as support.
Actionable Signal Matrix: XAUUSD (H1)
| Parameter | Value/Level | Rationale |
| Trade Type | BUY (Long) on Retracement | Dominant structural uptrend confirmed by higher highs and higher lows. Indicators are resetting for continuity. |
| Entry Zone | $3,745.00 – $3,755.00 | High-confluence zone encompassing the prior R1 Pivot, $3,753 local support, and the established bullish trendline.1 |
| Stop-Loss (Invalidation) | $3,719.50 | Clear structural break below the critical $3,721.231 chart support and S2 Pivot ($3,710.72).7 |
| Target 1 (T1) | $3,783.50 | Conservative target testing the immediate high resistance zone and R2 Pivot.6 |
| Target 2 (T2) | $3,808.00 | Aggressive target aligning with the R2 Pivot ($3,808.24) and the psychological $3,800 barrier.7 |
II. Macro-Fundamental Analysis: The Bullish Engine
Gold’s trajectory is heavily influenced by the relative strength of the U.S. Dollar (USD) and expectations surrounding the Federal Reserve’s monetary policy, combined with global risk premiums. The foundation for the current bullish impulse is exceptionally strong.
2.1 The Federal Reserve’s Policy and Real Rate Environment
The most significant immediate catalyst for gold is the anticipated shift toward monetary easing by the Federal Reserve. The Fed initiated this path with a 25 basis point cut to the federal funds rate target range in September.3 Market pricing suggests extreme certainty regarding further easing, with participants currently assigning a 90% chance of an additional 25 basis point cut in October, followed by high confidence in a subsequent reduction in December.3 The expectation of lower benchmark interest rates reduces the opportunity cost of holding gold, a non-yielding asset, thereby bolstering investment demand worldwide.
This dovish outlook, however, encounters a complex counter-narrative from recent U.S. economic data. The upward revision of Q2 2025 Real GDP growth to a robust annualized rate of 3.8% 8 signals a surprising resilience in the U.S. economy, largely fueled by robust consumer spending.8 This strength typically challenges the justification for rapid rate cuts, leading to a subtle dampening of extreme dovish expectations (futures markets recently priced in 40bp of cuts versus 45bp previously).10 The fact that gold continues to command high prices near its ATH despite this stronger-than-expected economic growth demonstrates that market participants are prioritizing deeper systemic concerns—such as inflation and geopolitical risk—over minor adjustments in the short-term interest rate outlook.
2.2 Persistent Inflation and the Safe-Haven Mandate
Gold is actively fulfilling its traditional role as a hedge against currency debasement and inflation. Inflationary pressures remain a key concern, despite the Fed’s September rate cut.8 Data shows the Core PCE price index (the Fed’s preferred inflation gauge) was revised higher for Q2 2025 to 2.60%.10 Furthermore, forecasts for the August core PCE suggest it will remain elevated at 3.00% year-over-year.11 These inflationary pressures are expected to persist, partly due to the impact of new trade policies and tariffs.11
The combined existence of strong, sticky inflation that exceeds the Fed’s target, paired with forward-looking expectations for moderating GDP growth (slowing into 2026) 8, suggests a growing environment conducive to a
stagflationary scenario. This setup is overwhelmingly positive for gold, which benefits both from currency debasement driven by high inflation and from capital flight toward safety amidst economic slowdowns. Geopolitical tensions and robust seasonal demand, particularly the start of the Navratri festival and advance buying for Diwali in India 3, further strengthen physical demand, providing a floor to the price structure.
III. Advanced Technical Structure Analysis (H1 Timeframe)
The technical structure on the 1-hour chart confirms that the recent price activity is corrective rather than reversal in nature, aligning perfectly with the overarching bullish trend.
3.1 Trend Confirmation and Corrective Structure
The XAUUSD chart exhibits a sustained bullish structure defined by a series of higher highs and higher lows.1 The price recently broke out of a consolidation channel and definitively reclaimed the psychological 3750 level.1 The current retracement from the $3,790 peak is interpreted as a healthy momentum reset required to sustain the uptrend. Short-term expectations suggest initial consolidation to fully digest the gains before attempting a decisive break above the recent historical high.4
3.2 Critical Confluence Zones and Pivot Point Validation
To identify reliable entry and risk management thresholds, the analysis uses institutional pivot point systems (Classic/Standard) alongside visible chart support levels. This validates the designated entry and stop-loss zones.
XAUUSD H1 Key Confluence Zones and Trading References
| Level Type | Classic Pivot 7 | Institutional 6 | Local Support Reference | Confluence Area ($) | Strategic Function | ||
| R3 | $3,832.85 | – | – | $3,830 – $3,835 | Major Breakout Target. | ||
| R2 | $3,808.24 | $3,783.94 | ATH Test ($3,790.82) 1 | $3,784 – $3,810 | Target 1 & 2 Zone. | ||
| R1 | $3,784.09 | $3,766.66 | Last Price ($3,759.855) [Chart] | $3,760 – $3,767 | Immediate Overhead Barrier. | ||
| S1 | $3,735.33 | – | Immediate Support ($3,753) 1 | $3,735 – $3,755 | Primary Entry Zone (Buy the Dip). | ||
| S2 | $3,710.72 | $3,704.82 | Chart Support ($3,721.231) [Chart] | $3,705 – $3,722 | Critical Invalidation Zone (SL). |
The identified Entry Zone ($3,745 – $3,755) sits strategically between the immediate local support level of $3,753 1 and the 1st Support Level (S1) Pivot at $3,735.33.7 Capturing a rebound in this zone ensures a favorable risk-to-reward ratio, capitalizing on the assumption that strong buyers will defend the retest of the recent breakout area.
The Stop-Loss (SL) Invalidation Level ($3,719.50) is set deliberately below the visible structural support line on the H1 chart ($3,721.231) [Chart]. This level also provides a buffer above the robust S2 Pivot confluence ($3,704.82 – $3,710.72).6 A decisive close below $3,719.50 would constitute a clear failure of the current bullish sequence of higher lows, justifying immediate capital preservation.
IV. Momentum and Volatility Deep Dive (Oscillator Metrics)
Assessment of technical oscillators provides critical context regarding the health of the current momentum and the potential for a reversal. The current readings confirm that momentum is resetting, clearing the path for the next bullish impulse.
4.1 H1 Indicator Status
Recent XAUUSD H1 indicator readings underscore the neutral but structurally bullish environment.5
The RSI(14) reading of 50.891 is precisely mid-range.5 This neutral reading is a positive development, indicating that the recent pullback has efficiently worked off any previously overbought conditions that might have stalled the rally, thereby creating capacity for future upward movement.12 The
MACD(12,26) value of 7.34 remains positive, indicating that the momentum of the bulls is still dominant over the bears in the short term, despite the current price retracement.5
The ADX(14) value is relatively high at 31.839, confirming that a strong, directional trend is established.5 The
ATR(14) reading of 10.8028 signals high volatility 5, necessitating wider stop-loss placements than normal to accommodate intraday price fluctuations and “noise.”
4.2 Advanced Divergence Detection Protocol
While standard oscillators are neutral, a crucial technical observation involves the potential development of divergence, which signals a loss of underlying momentum.13 Given the expectation of continuation, professional analysis focuses on detecting a
Hidden Bullish Divergence.14
A Hidden Bullish Divergence occurs when the price forms a higher low (as it retests the entry zone) while the MACD or RSI indicator simultaneously forms a lower low.14 If this pattern confirms as XAUUSD bounces from the $3,745–$3,755 entry range, it serves as the highest conviction technical confirmation that selling pressure is rapidly diminishing and that the main uptrend is set to resume. This observation provides a supplementary technical trigger for the Buy signal.
V. Trading Strategy and Execution Protocol
5.1 Detailed Execution Plan
The execution strategy is based on a structured, disciplined limit order system to capture the rebound from the identified structural support.
- Entry Strategy: Utilize limit orders to achieve an average entry price within the $3,745.00 – $3,755.00 entry zone.
- Risk Management: The Stop-Loss must be set immediately and rigorously at $3,719.50. Given the high volatility noted by the ATR, maintaining this hard stop is essential.
- Profit Taking (T1): Secure initial profits by closing 50% of the position at Target 1 ($3,783.50). Immediately upon T1 being achieved, adjust the Stop-Loss for the remaining 50% of the position to the original entry price (break-even) to eliminate risk on the trade.
- Profit Taking (T2): Target the remaining 50% toward the aggressive objective of $3,808.00, aligning with the R2 Pivot 7 and the anticipated extension beyond the $3,800 psychological level.
5.2 Economic Event Management Protocol
Market volatility is highly sensitive to US economic data, which directly impacts the USD and thus XAUUSD pricing. Traders must exercise extreme caution around scheduled high-impact releases.15
A key event is the release of the Personal Income and the PCE Deflator report.18 Given that the market is acutely focused on sticky inflation, any unexpected results could trigger rapid price movement. For example, if the core PCE data proves significantly stronger than the 3.00% forecast, it could rapidly strengthen the USD on fears that the Fed may slow its easing cycle. Conversely, a much weaker reading would validate aggressive rate cuts and likely propel gold toward $3,800. Due to the inherent risk and high volatility (high ATR) surrounding these releases, position sizing should be conservative, and trades should be managed actively during the announcement windows.
VI. Alternative Scenarios and Contingency Planning
A comprehensive strategy requires defining clear exit parameters for scenarios where the market fails to adhere to the primary prediction.
6.1 Bearish Contingency: Structural Breakdown
If the market experiences a definitive close (two consecutive H1 candles) below the critical structural support at $3,719.50, the bullish trade structure is invalidated. This event would signal a rejection of the recent uptrend and the commencement of a deeper corrective phase, potentially fueled by fundamental changes, such as unexpected hawkish shifts following economic data. In this scenario, the long position must be immediately closed. An aggressive reversal trade might then be considered, initiating a short position targeting the S3 confluence zone ($3,687.54).6
6.2 Immediate Bullish Breakout Scenario
Should XAUUSD fail to retest the optimal entry zone and instead gain immediate upside momentum, closing an H1 candle decisively above the recent ATH ($3,790.82) 1, it signals overwhelming buying pressure. In this case, a breakout long trade can be initiated above $3,791.00. The target remains T2 ($3,808.00), but the Stop-Loss must be placed tightly below the previous ATH (e.g., $3,784.00), utilizing the newly breached ATH as immediate foundational support.
VII. Concluding Summary
The synthesis of technical structure analysis and macroeconomic context provides strong conviction for a long position in XAUUSD. The prevailing trend is structurally bullish, fueled by the expectation of declining real rates and robust inflation hedging demand. The current price activity is a technical correction that is effectively resetting short-term indicators for continuation. The professional recommendation is to implement a “Buy the Dip” strategy by placing entry orders within the designated high-confluence support zone of $3,745.00 – $3,755.00, while adhering strictly to the non-negotiable Stop-Loss at $3,719.50 to mitigate tail risk. Execution discipline and awareness of upcoming high-impact economic releases are paramount to successfully capitalizing on this structural opportunity.
Works cited
- XAUUSD Chart — Gold Spot US Dollar Price – TradingView, accessed on September 28, 2025, https://www.tradingview.com/symbols/XAUUSD/
- XAUUSD (Gold) forecasts 2025 & other predictions – RoboForex, accessed on September 28, 2025, https://roboforex.com/beginners/analytics/forex-forecast/commodities/
- Gold price prediction today: Will gold rate continue to hit new lifetime highs in the near-term? Here’s the outlook, accessed on September 28, 2025, https://timesofindia.indiatimes.com/business/india-business/gold-price-prediction-today-india-where-is-gold-rate-headed-on-september-24-2025-mcx-gold-futures-outlook/articleshow/124082894.cms
- Gold Spot / U.S. Dollar Trade Ideas — OANDA:XAUUSD – TradingView, accessed on September 28, 2025, https://www.tradingview.com/symbols/XAUUSD/ideas/?sort=recent
- XAU USD Technical Analysis – Investing.com, accessed on September 28, 2025, https://www.investing.com/currencies/xau-usd-technical
- XAU USD Chart & Rate – XAU USD Trading – FOREX.com UK, accessed on September 28, 2025, https://www.forex.com/en-uk/gold-silver-trading/xau-usd/
- XAUUSD Barchart Opinion for Gold Forex, accessed on September 28, 2025, https://www.barchart.com/forex/quotes/%5EXAUUSD/opinion
- US Economic Resilience: A Double-Edged Sword for Global Markets Amidst Shifting Tides, accessed on September 28, 2025, https://markets.financialcontent.com/wral/article/marketminute-2025-9-26-us-economic-resilience-a-double-edged-sword-for-global-markets-amidst-shifting-tides
- Consumer Discretionary Sector Stumbles: Economic Headwinds and Shifting Consumer Sentiment Drive -1.47% Decline – Stock Market | FinancialContent, accessed on September 28, 2025, https://markets.financialcontent.com/wral/article/marketminute-2025-9-26-consumer-discretionary-sector-stumbles-economic-headwinds-and-shifting-consumer-sentiment-drive-147-decline
- MNI U.S. Macro Weekly, accessed on September 28, 2025, https://media.marketnews.com/US_macro_weekly_250926_2c7e5a25ef.pdf
- Forecasts for August PCE Report Shows Some Cooling, but Tariff Impacts Persist, accessed on September 28, 2025, https://www.morningstar.com/economy/forecasts-august-pce-report-shows-some-cooling-tariff-impacts-persist
- MACD and RSI Strategy: 73% Win Rate – Rules, Settings – QuantifiedStrategies.com, accessed on September 28, 2025, https://www.quantifiedstrategies.com/macd-and-rsi-strategy/
- RSI Divergence Trading Strategy for Gold: How to Identify and Trade Trend Reversals, accessed on September 28, 2025, https://acy.com/en/market-news/education/how-to-spot-rsi-divergence-gold-j-o-093126/
- Unlock Peak Profits: Mastering RSI & MACD Divergence in Crypto & Forex, accessed on September 28, 2025, https://www.kavout.com/market-lens/unlock-peak-profits-mastering-rsi-and-macd-divergence-in-crypto-and-forex
- Economic Calendar – Investing.com, accessed on September 28, 2025, https://m.investing.com/economic-calendar/
- Economic Calendar — World Economic Events – TradingView, accessed on September 28, 2025, https://www.tradingview.com/economic-calendar/
- Economic Calendar – Trading Economics, accessed on September 28, 2025, https://tradingeconomics.com/calendar
- Economic Indicators Calendar – FEDERAL RESERVE BANK of NEW YORK, accessed on September 28, 2025, https://www.newyorkfed.org/research/calendars/nationalecon_cal
Leave a Reply